🔎 Market Structure Comparison
This document is also available as a .docx Word document: Market Structure Overview.docx
Overview
Section titled “Overview”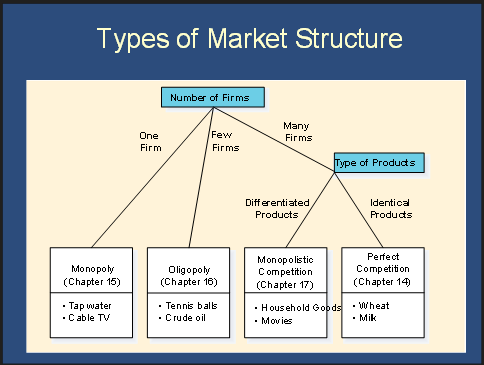
| Perfect Competition | Monopolistic Competition |
Monopoly | Oligopoly (I added this column) | |
|---|---|---|---|---|
| Number of Firms | Very many | Many | One | Few |
| Output of Different Firms | Identical | Differentiated | --- | Identical or Differentiated |
| View of Pricing | Price taker | Price maker | Price maker | Depends |
| Barriers to Entry/Exit | No | No | Yes | Yes |
| Output and Pricing | at min AC | below min AC | below min AC | Use Game Theory |
| SR Profit | Positive, zero, or negative | Positive, zero, or negative | Positive, zero, or negative | Positive, zero, or negative |
| LR Profit | Zero | Zero | Positive or Zero | Positive or Zero |
| Advertising | Never | Always | Sometimes (PR Type) | Depends |
In perfect competition, monopoly, and monopolistic comp, you can do to find the optimal quantity (). In perfect competition, , so we can also do . However, we can’t do this in monopolistic comp or in monopoly, because in those market structures, . Of course, for discrete goods, we produce highest q, where .
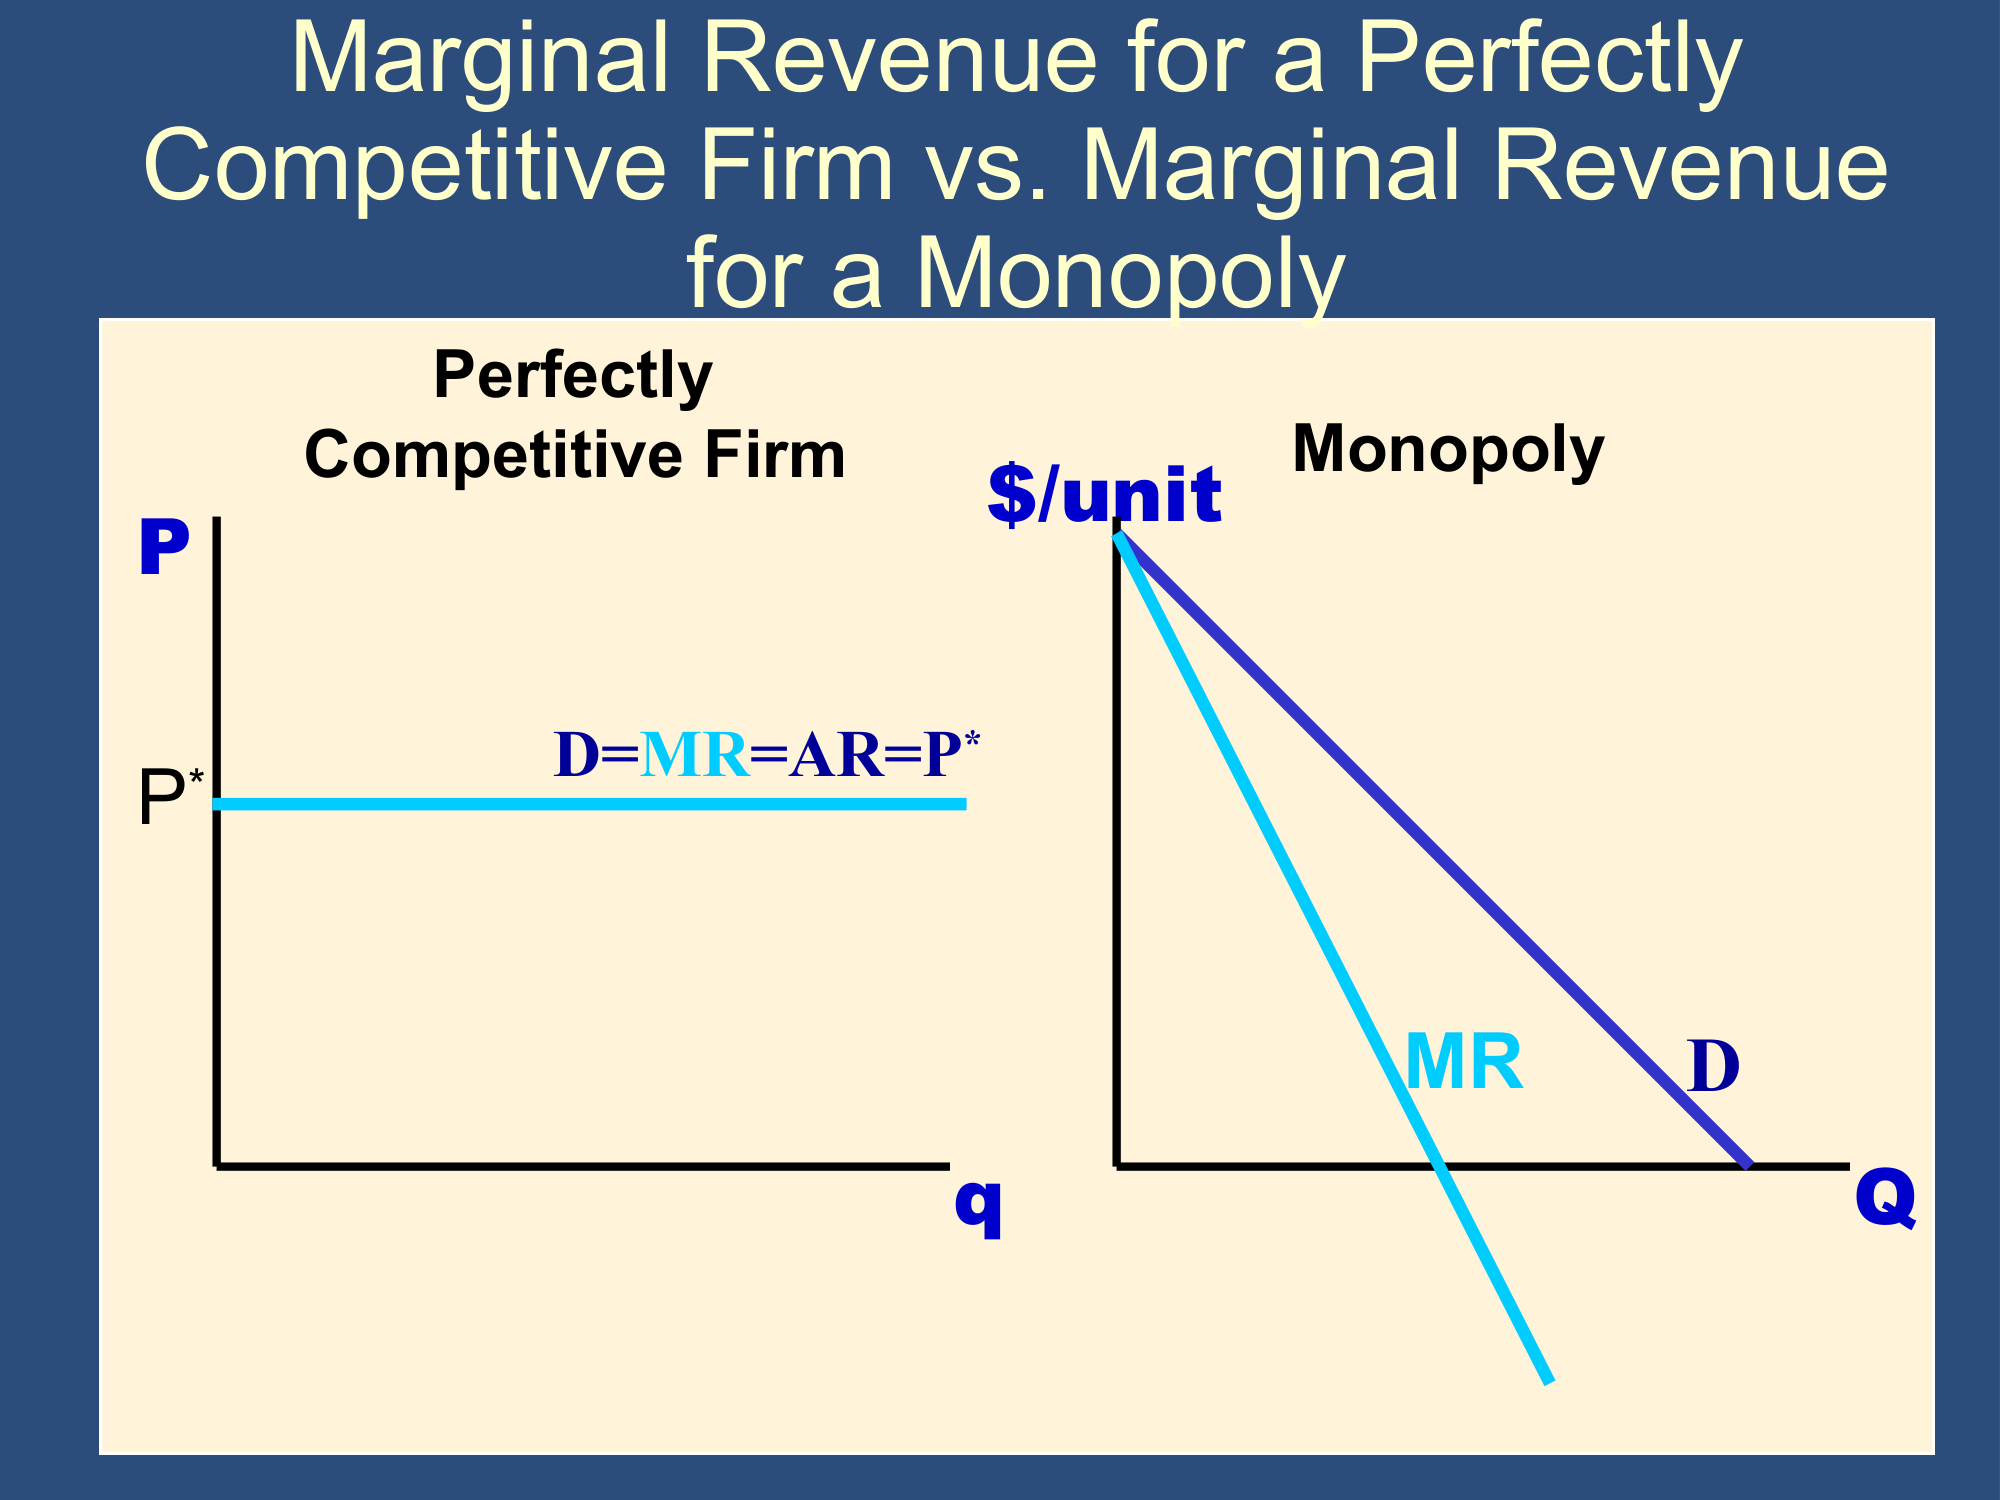
Perfect Competition
Monopoly and Monopolistic Comp
Perfect Competition
Section titled “Perfect Competition”How to “solve” a perfect competition problem:
1.) to figure out
2.) Do you shut down () or, in LR, exit ()
3.) Wrap up
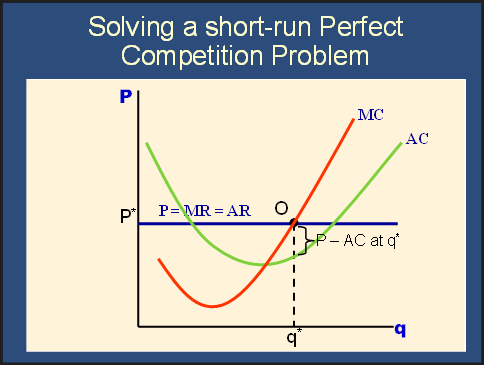
Perfect Competition, Long Run
Section titled “Perfect Competition, Long Run”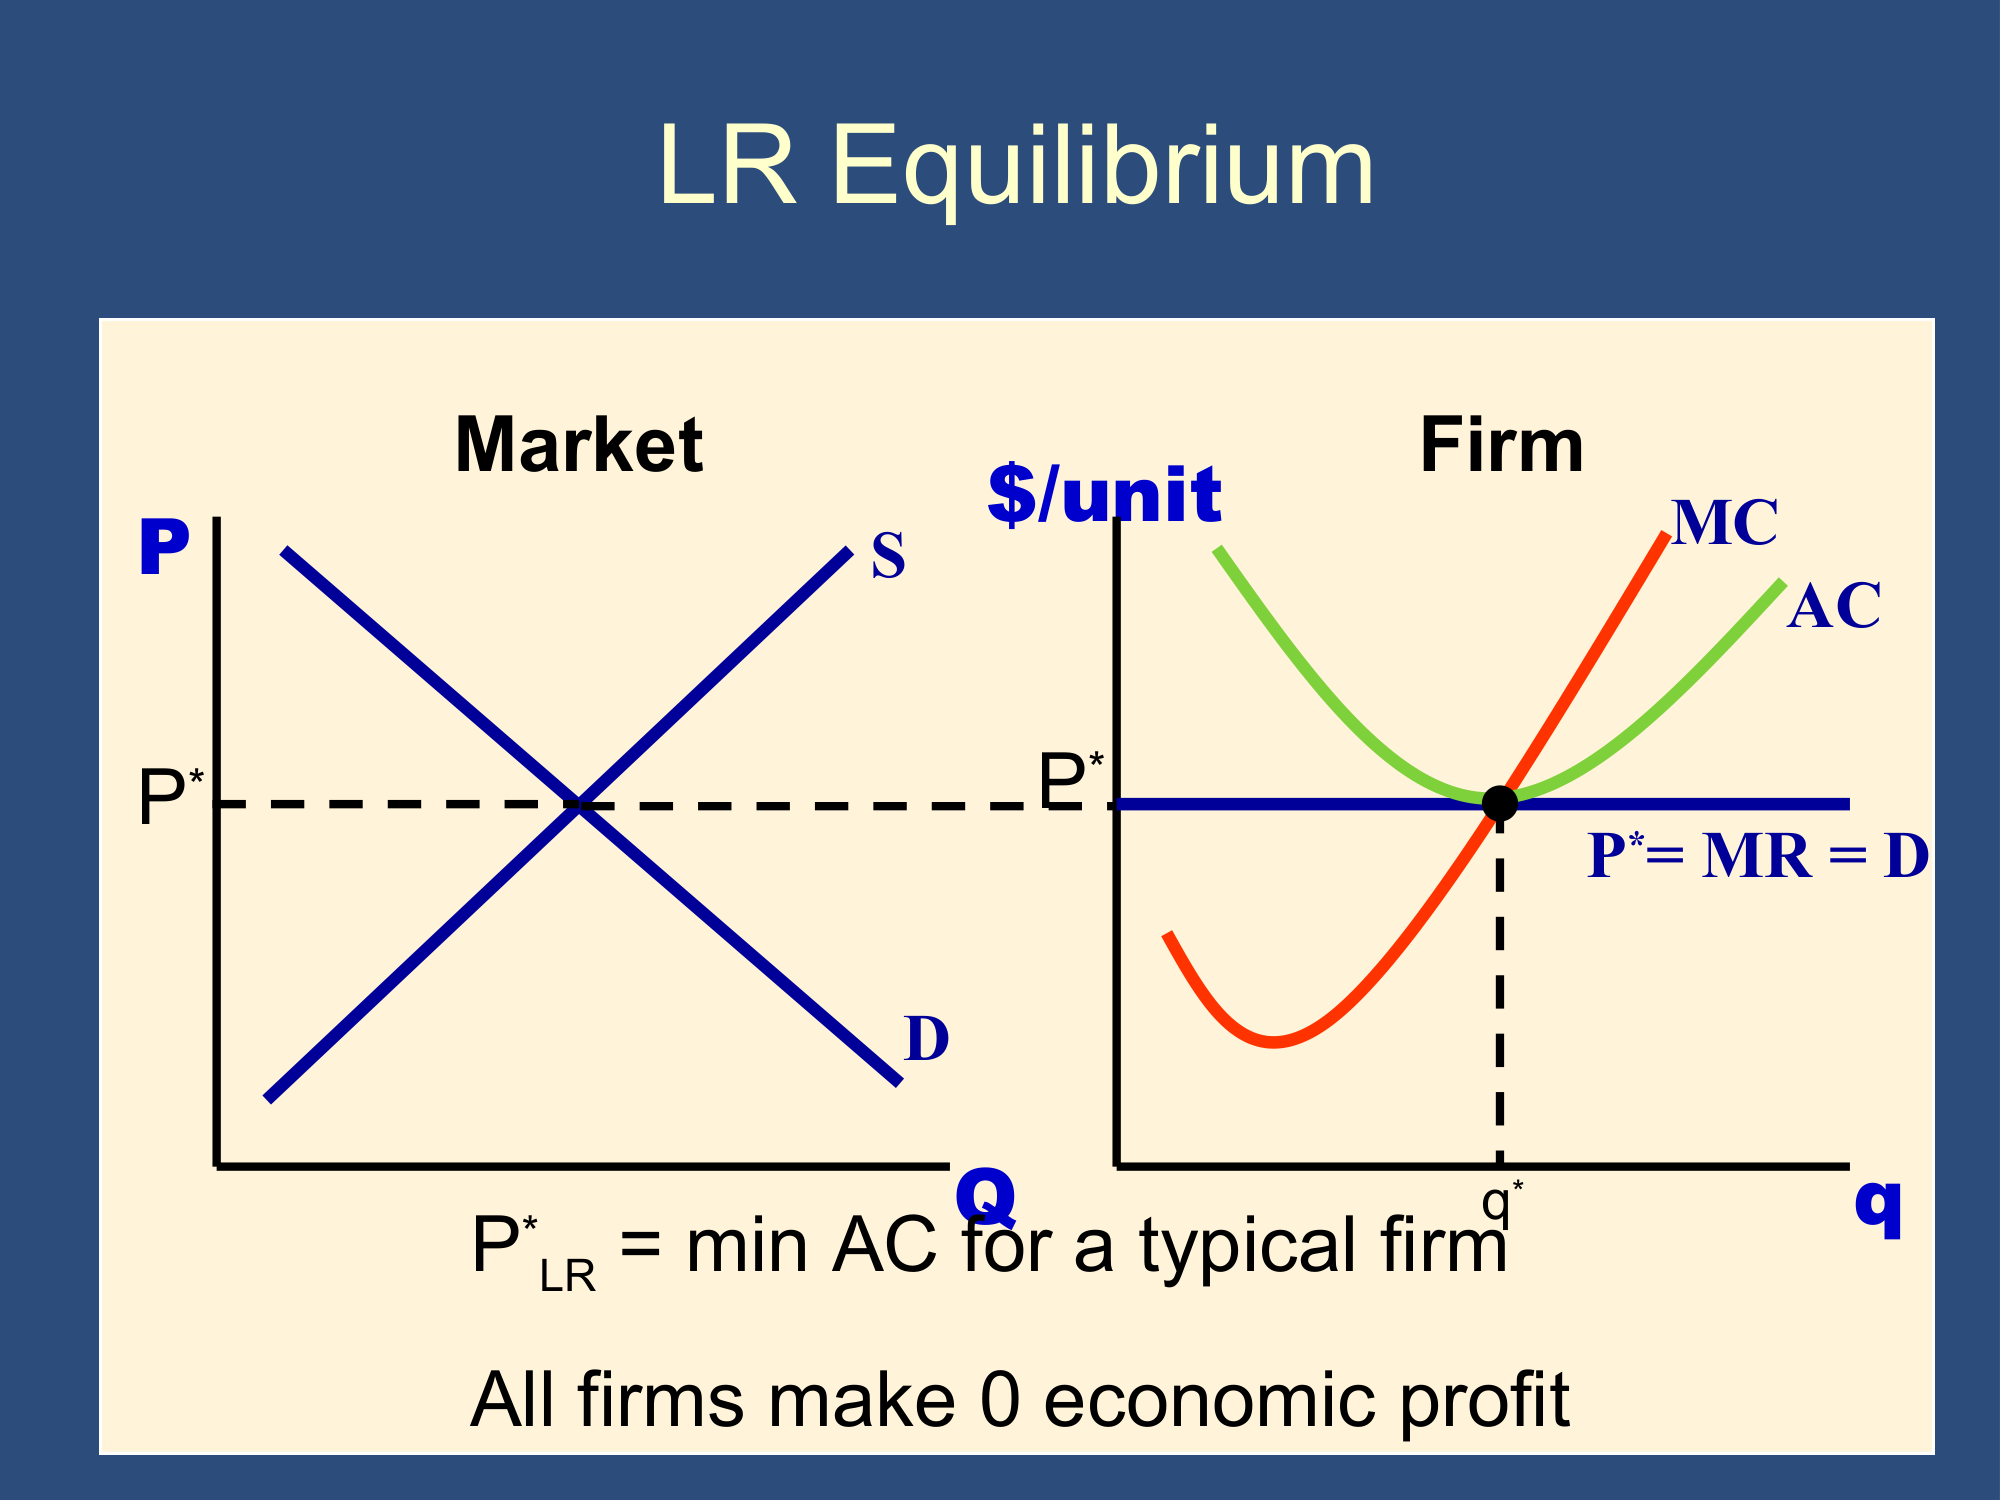
Monopoly
Section titled “Monopoly”How to “solve” a Monopoly problem
1.) to figure out Q
2.) Draw a line up to the demand curve to figure out P
3.) Wrap up.
Monopoly, Short Run and Long Run (with profits)
Section titled “Monopoly, Short Run and Long Run (with profits)”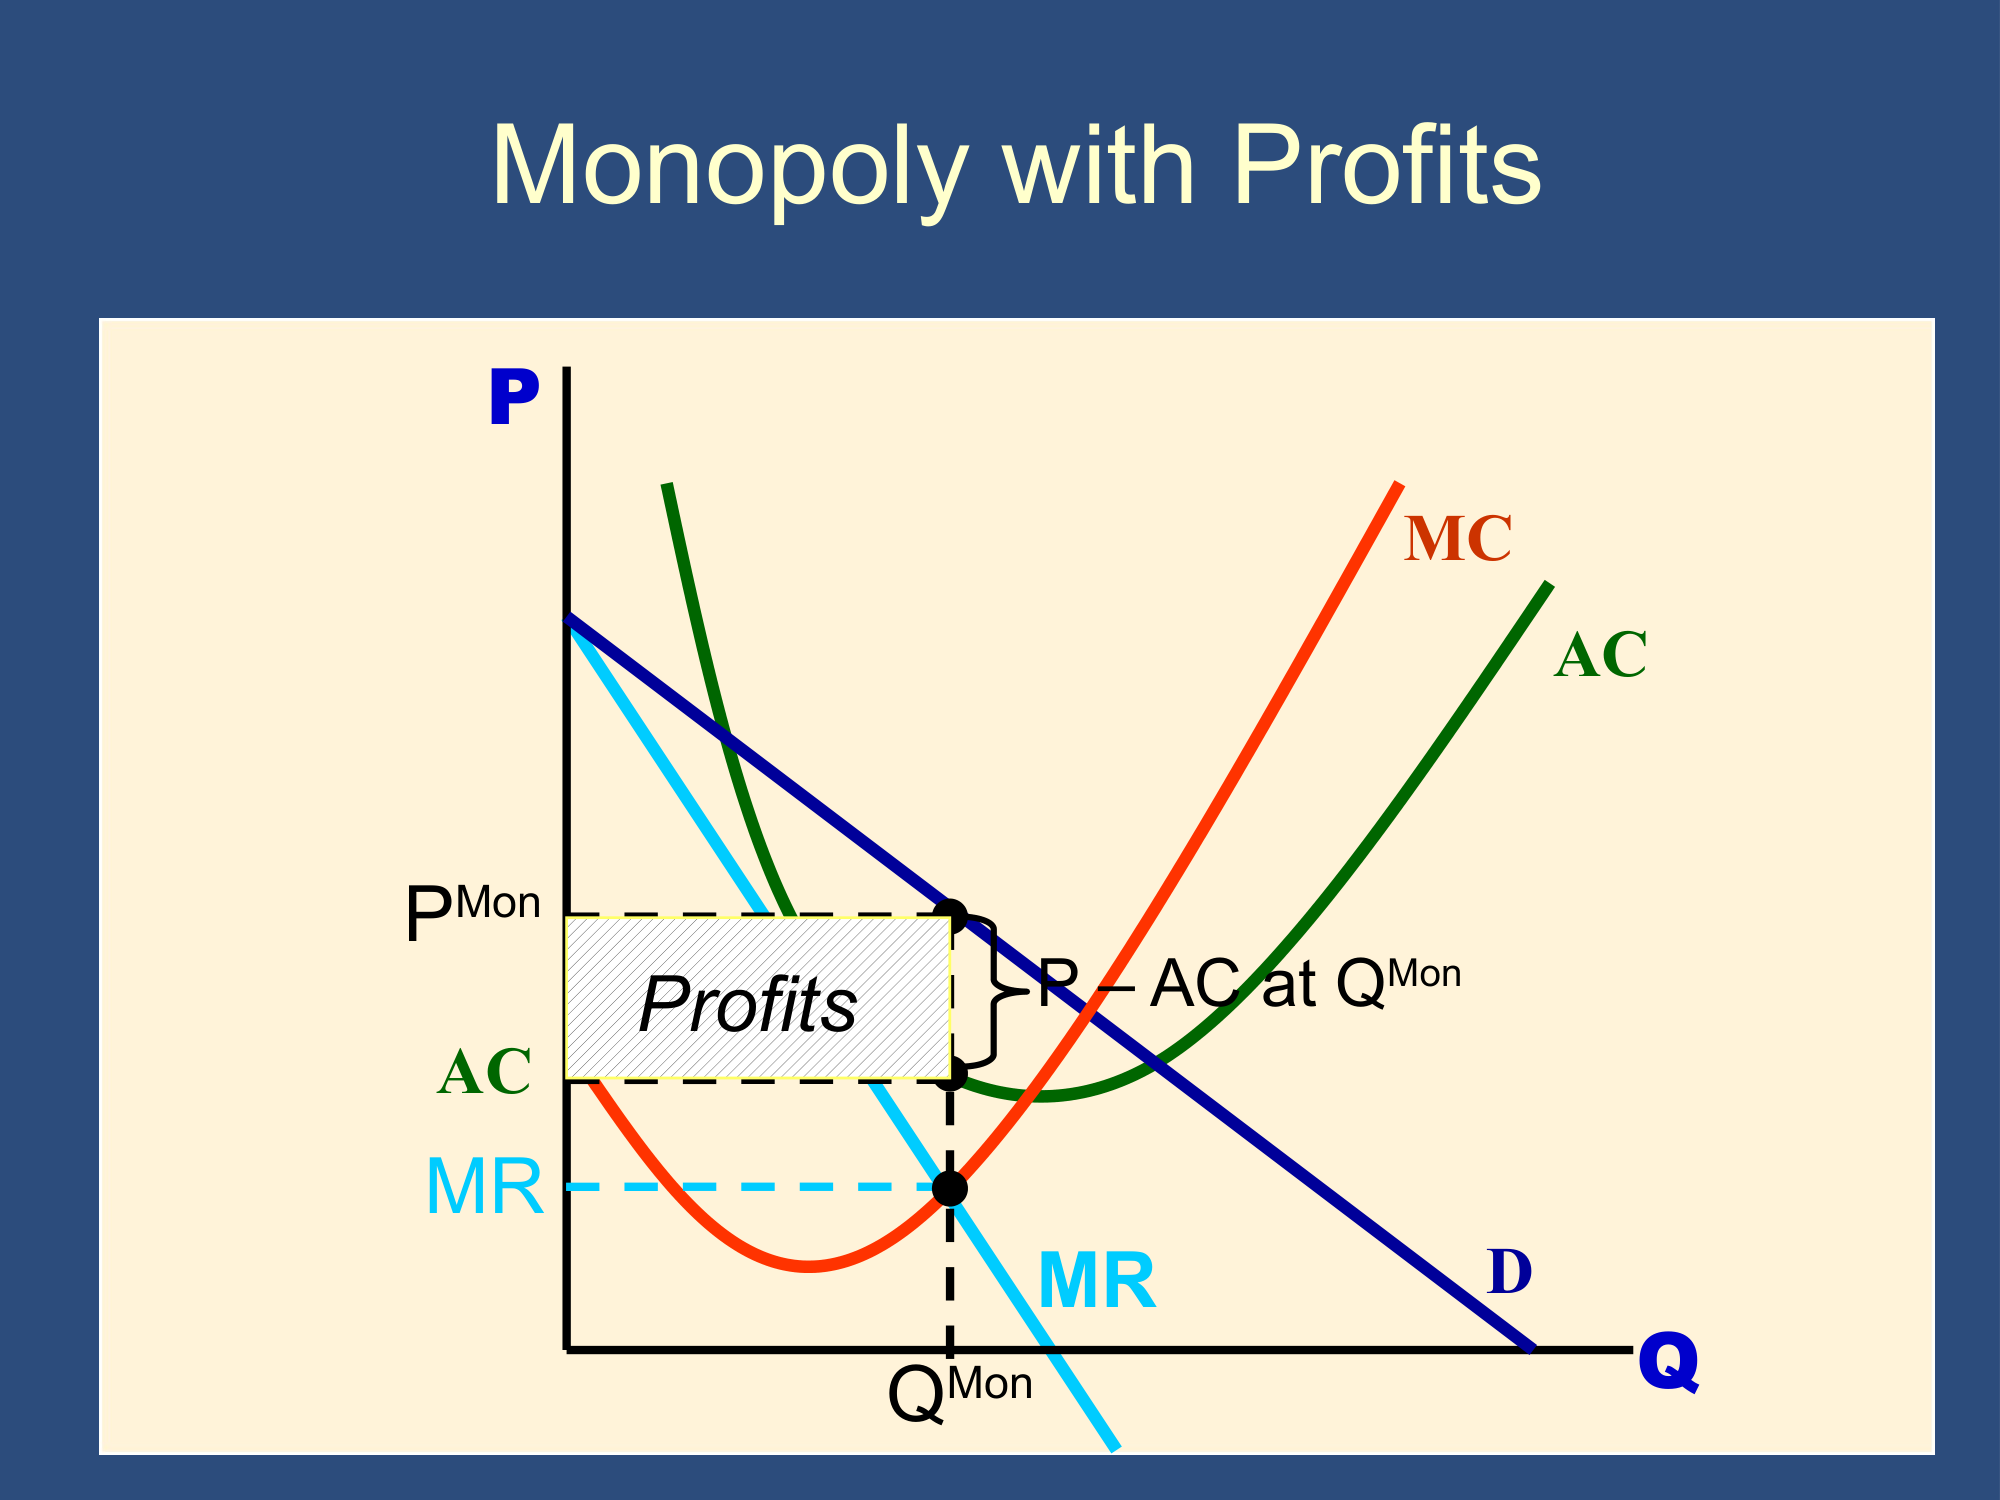
Monopolistic Competition
Section titled “Monopolistic Competition”How to “solve” a monopolistic competition problem:
Solve Monopolistic Competition just like Monopoly, except that in the long run, the demand curve shifts until it is tangent to AC and .
Monopolistic Competition, Long Run
Section titled “Monopolistic Competition, Long Run”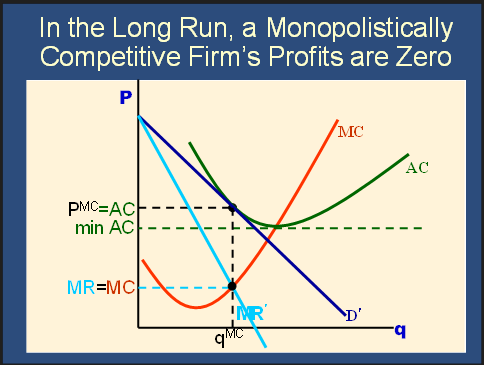
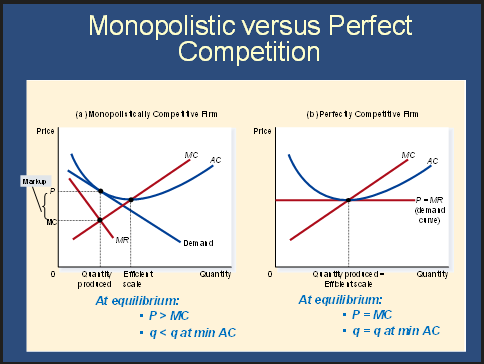
The following diagrams show long run equilibria in Monopolistic Competition and Perfect Competition.
Oligopoly
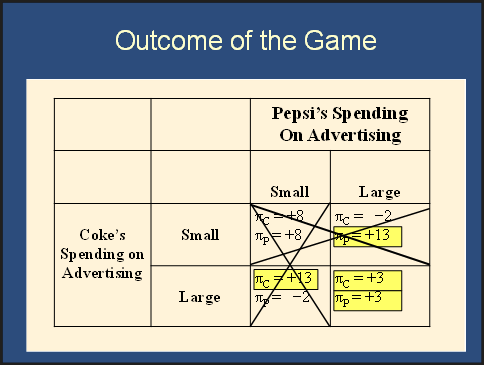
Section titled “Oligopoly”There’s no single diagram. Because of strategic interdependence, we use different game theoretic models to illustrate different oligopolistic scenarios.
Feedback? Email munger.e1010@gmail.com 📧. Be sure to mention the page you are responding to.