Skip to content

✏️ Calculations with areas

The following questions are all based on the following diagram:
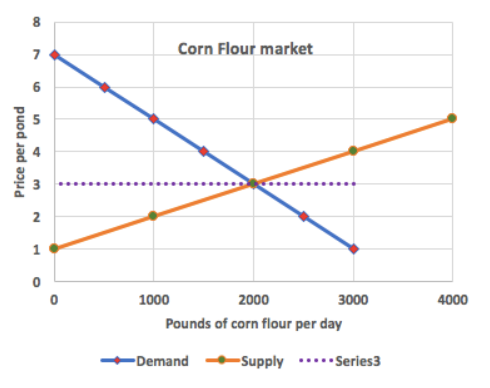
Corn Flour market supply and demand graph. Price per pound on the y axis (0 to 8) and pounds of corn flour per day on the x axis (0 to 4000). A downward sloping Demand line runs from (0, 7) to (3000, 1). An upward sloping Supply line runs from (0, 1) to (4000, 5). The two lines intersect at equilibrium (2000, 3). A horizontal dotted Series3 line is drawn at price 3 across the full quantity range.

✏️ Under perfect competition, what are CS, PS, and TS?

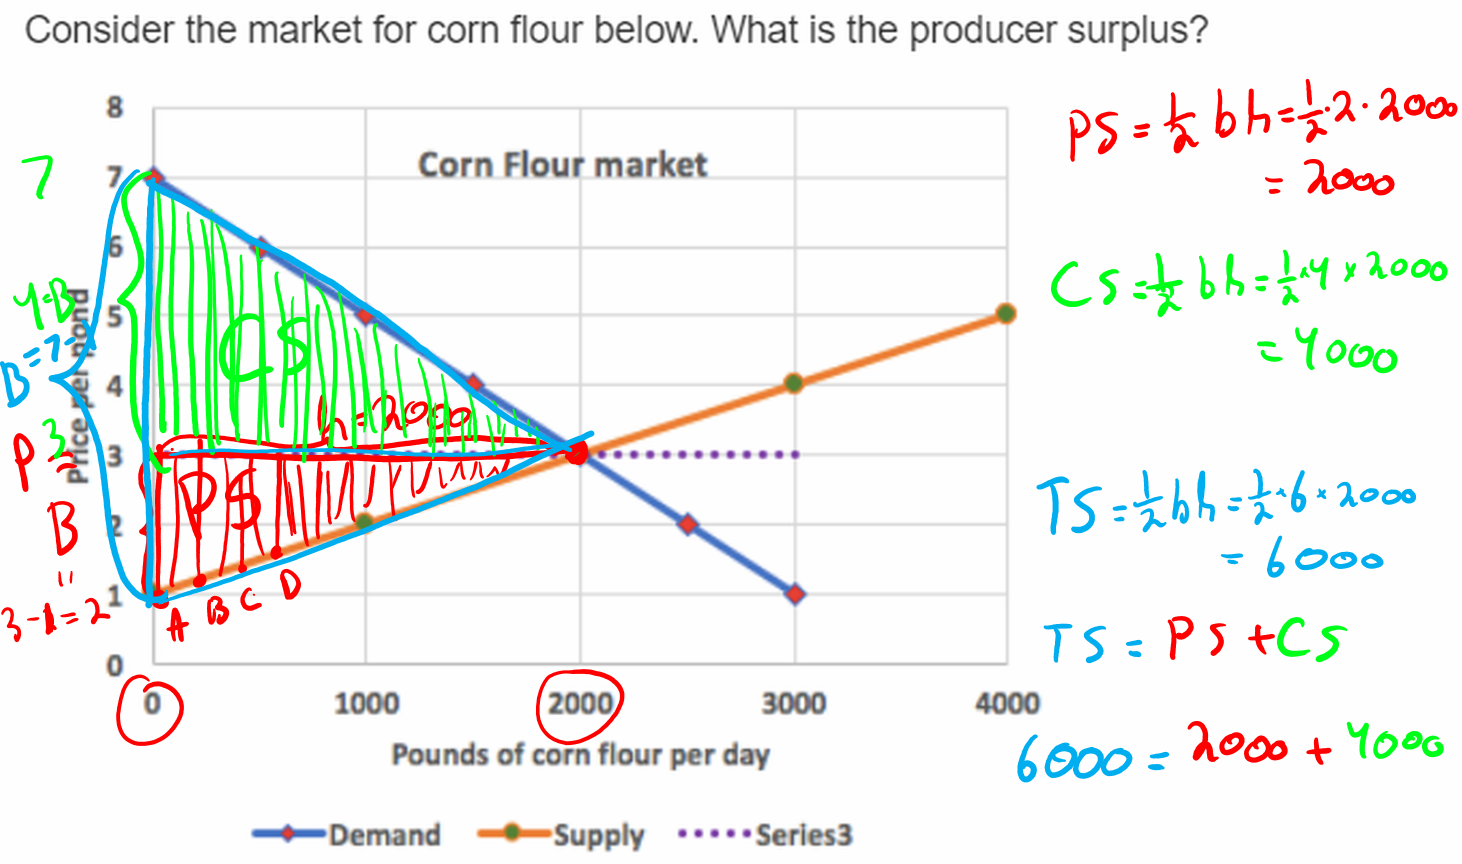
✔ Click here to view answer Hand-annotated Corn Flour market diagram solving for Consumer Surplus, Producer Surplus, and Total Surplus under perfect competition. Green shading marks the CS triangle above the equilibrium price of 3; pink shading marks the PS triangle below. Handwritten calculations show PS equals one-half times b times h equals one-half times 2 times 2000 equals 2000. CS equals one-half times b times h equals one-half times 4 times 2000 equals 4000. TS equals one-half times b times h equals one-half times 6 times 2000 equals 6000. TS equals PS plus CS: 6000 equals 2000 plus 4000. Equilibrium is at quantity 2000 and price 3.
✏️ Suppose a price floor of $6 was imposed.

✔ Click here to view answer