Skip to content

✏️ Can you identify whether QEff or QMkt is higher by looking at the triangles?

I need to figure out whether QEff or QMkt is higher. Can I figure that out by looking at triangles that represent deadweight loss.

I think it’s much easier to just figure out the QEff and QMkt directly.
To find QMarket, just look at the intersection of Supply and Demand. 🙂
To find QEfficient, just look at the intersection of MSC and MSB. If you don’t have an MSC or and MSB curve, you can probably use the Supply and Demand curves (respectively) as substitutes.

  • If there are no consumption externalities, you can use the Demand curve for MSB and if there are no production externalities, you can use the the Supply curve for MSC.

Positive Consumption Externality
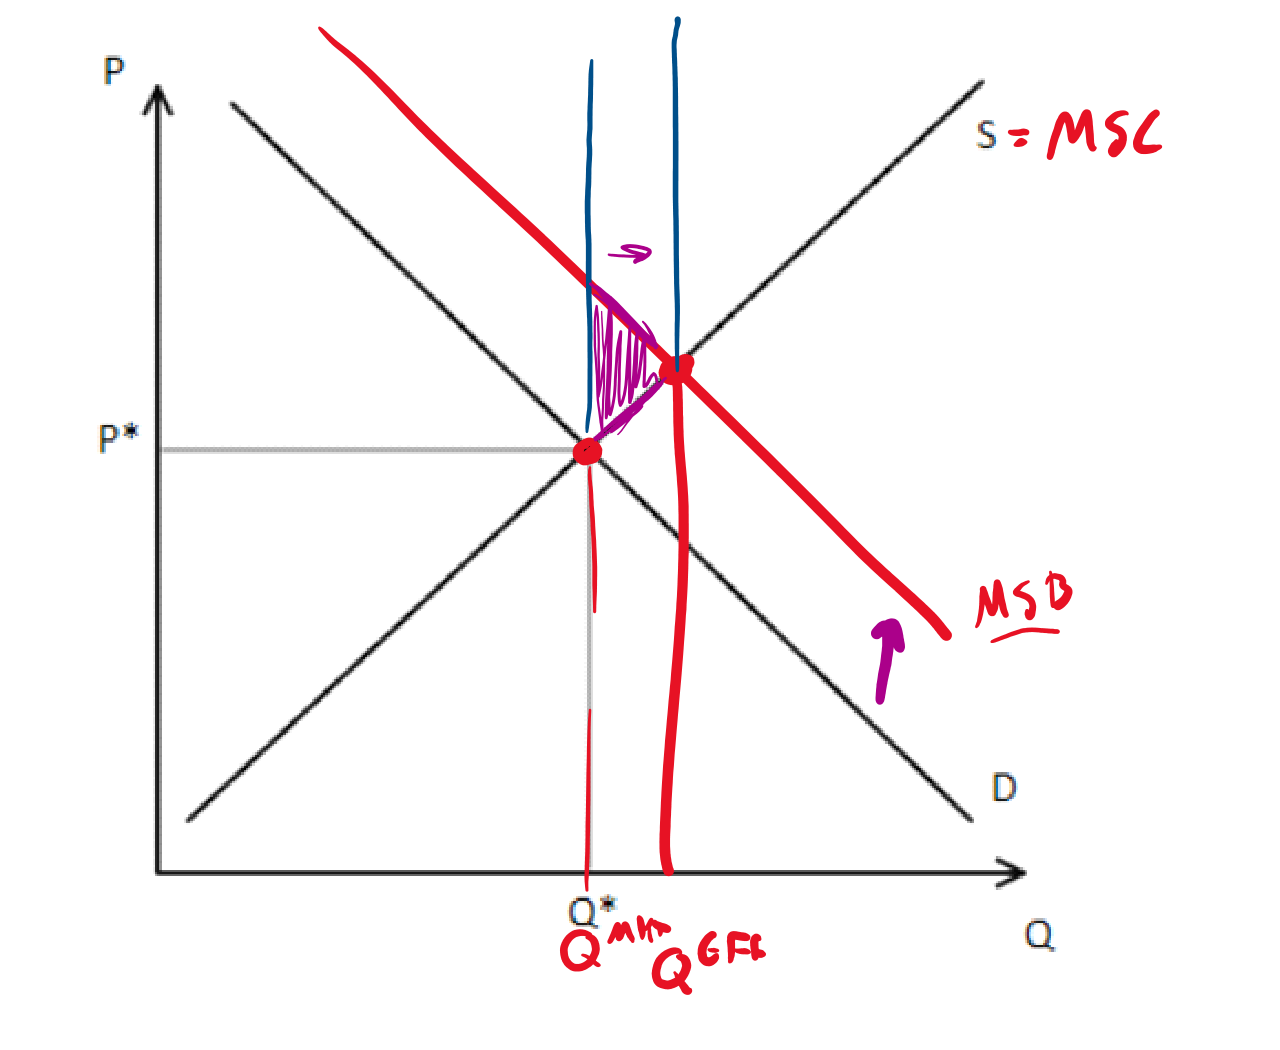
Hand-drawn supply and demand diagram illustrating a positive consumption externality. The black Supply and Demand curves intersect at price P* and quantity Q*_mkt. Red ink adds an MSB curve above Demand (labeled MSB) and relabels Supply as S = MSC, with a purple arrow showing the upward shift from D to MSB. The intersection of MSC and MSB sits to the right of the market equilibrium at Q_Eff, so Q_Eff exceeds Q_Mkt. A hatched purple triangle between Q_Mkt and Q_Eff marks the deadweight loss from under-consumption.

DWL happens when:

  1. When you consume something and MSC>MSBMSC > MSB
  2. When you don’t consume something and the MSB>MSCMSB > MSC

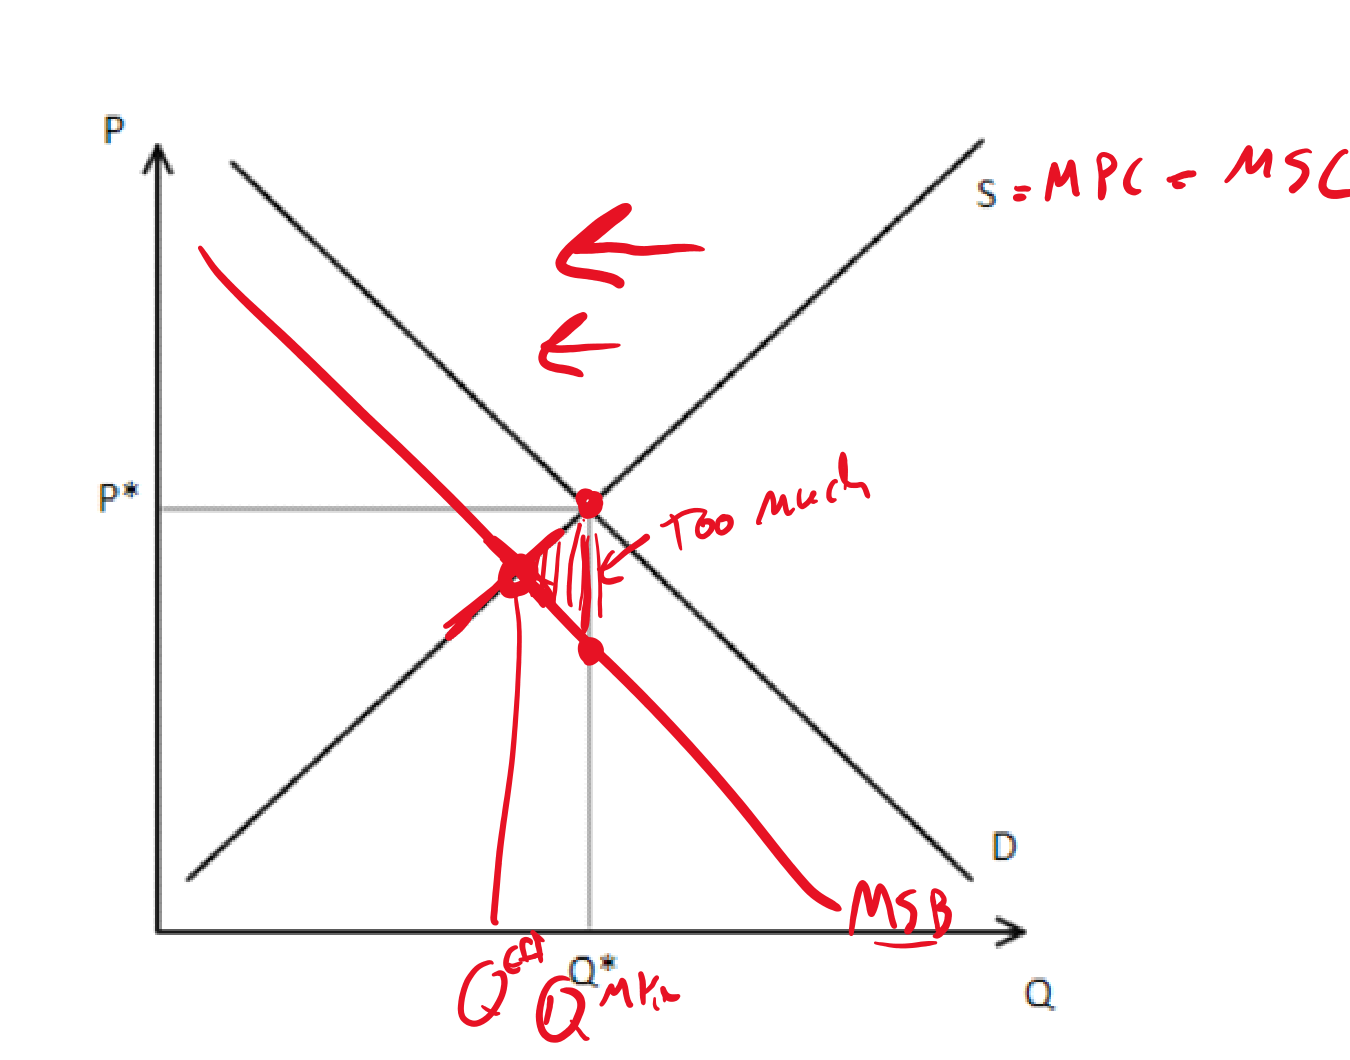
Negative Consumption Externality

Hand-drawn supply and demand diagram illustrating a negative consumption externality. The black Supply and Demand curves meet at price P* and quantity Q*_Mkt (to the right). Red ink adds an MSB curve below Demand (labeled MSB) and labels Supply as S = MPC = MSC. Red arrows point left and down, indicating the MSB lies below D. The intersection of S=MSC and MSB sits to the left of the market equilibrium at Q^Eff, so Q_Eff is less than Q_Mkt. A hatched red triangle between Q_Eff and Q_Mkt marks the deadweight loss, annotated 'Too much' to indicate overconsumption relative to the efficient quantity.

To find QMarket, just look at the intersection of Supply and Demand. 🙂
To find QEfficient, just look at the intersection of MSC and MSB. If you don’t have an MSC or and MSB curve, you can probably use the Supply and Demand curves (respectively) as substitutes.
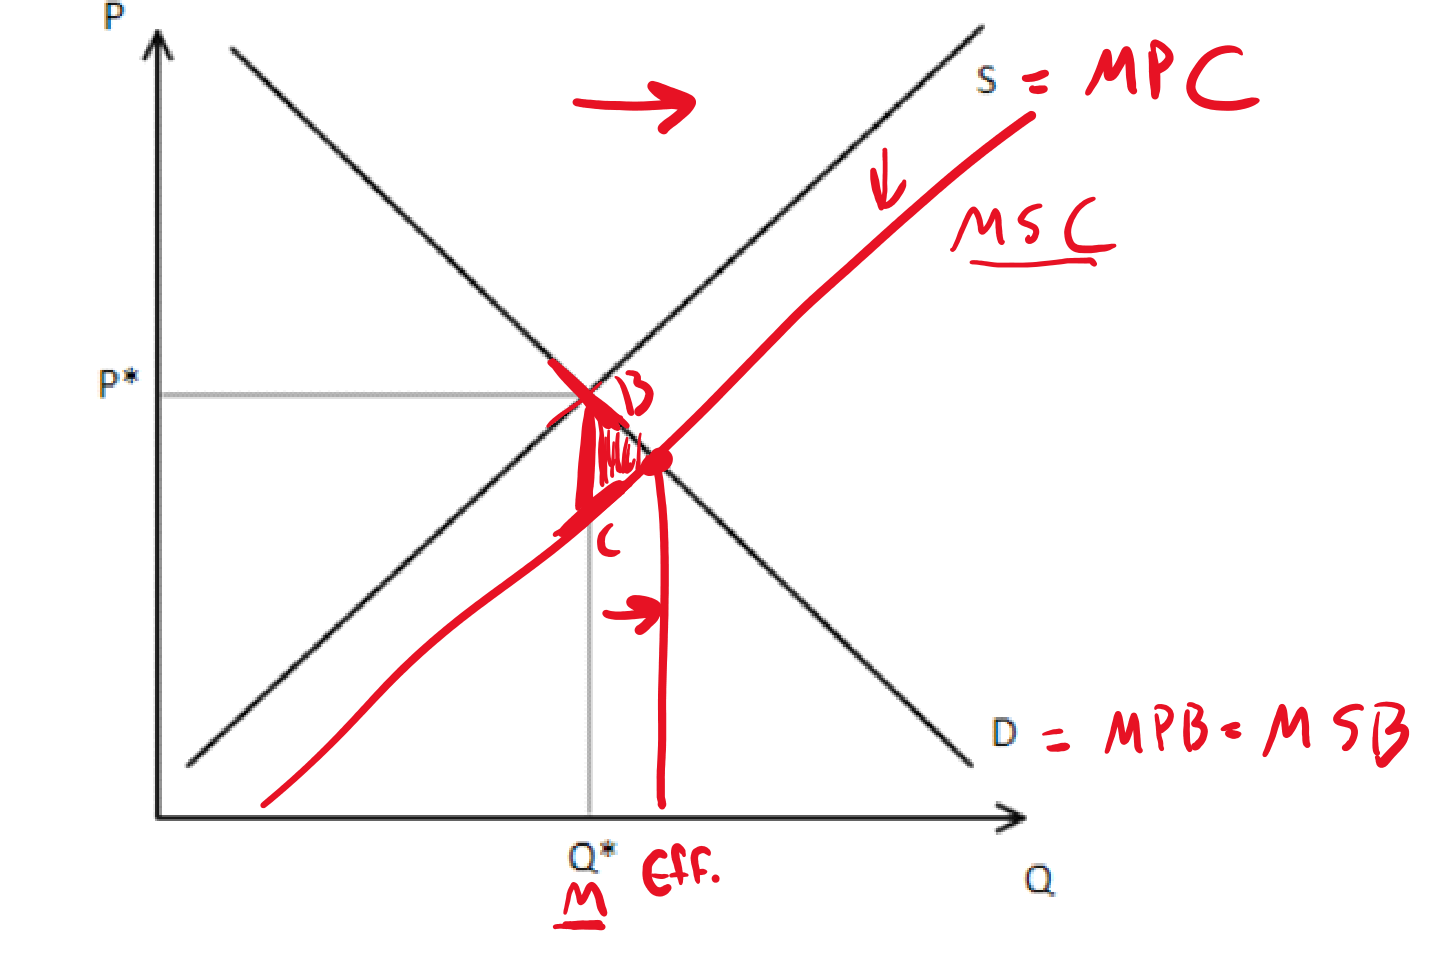
Hand-drawn supply and demand diagram illustrating a negative production externality. The black Supply curve (labeled S = MPC) and Demand curve (labeled D = MPB = MSB) intersect at price P* and quantity Q*_Mkt. Red ink adds an MSC curve above the Supply curve (labeled MSC), with a red arrow showing the upward shift from S to MSC. The intersection of MSC and Demand sits to the left of the market equilibrium, so the efficient quantity Q*_Eff is less than Q*_Mkt (indicated by the M label underneath Q*_Eff). A hatched red triangle between the two intersections, labeled with points B and C, marks the deadweight loss from overproduction.

The amount produced and consumed is determined by demand and supply.
In contrast, efficiency is determined by social costs and benefits. Therefore, QEFF is determined by the social lines: MSC and MSB.