👨🏫 Notes on E-1000 Lecture 4
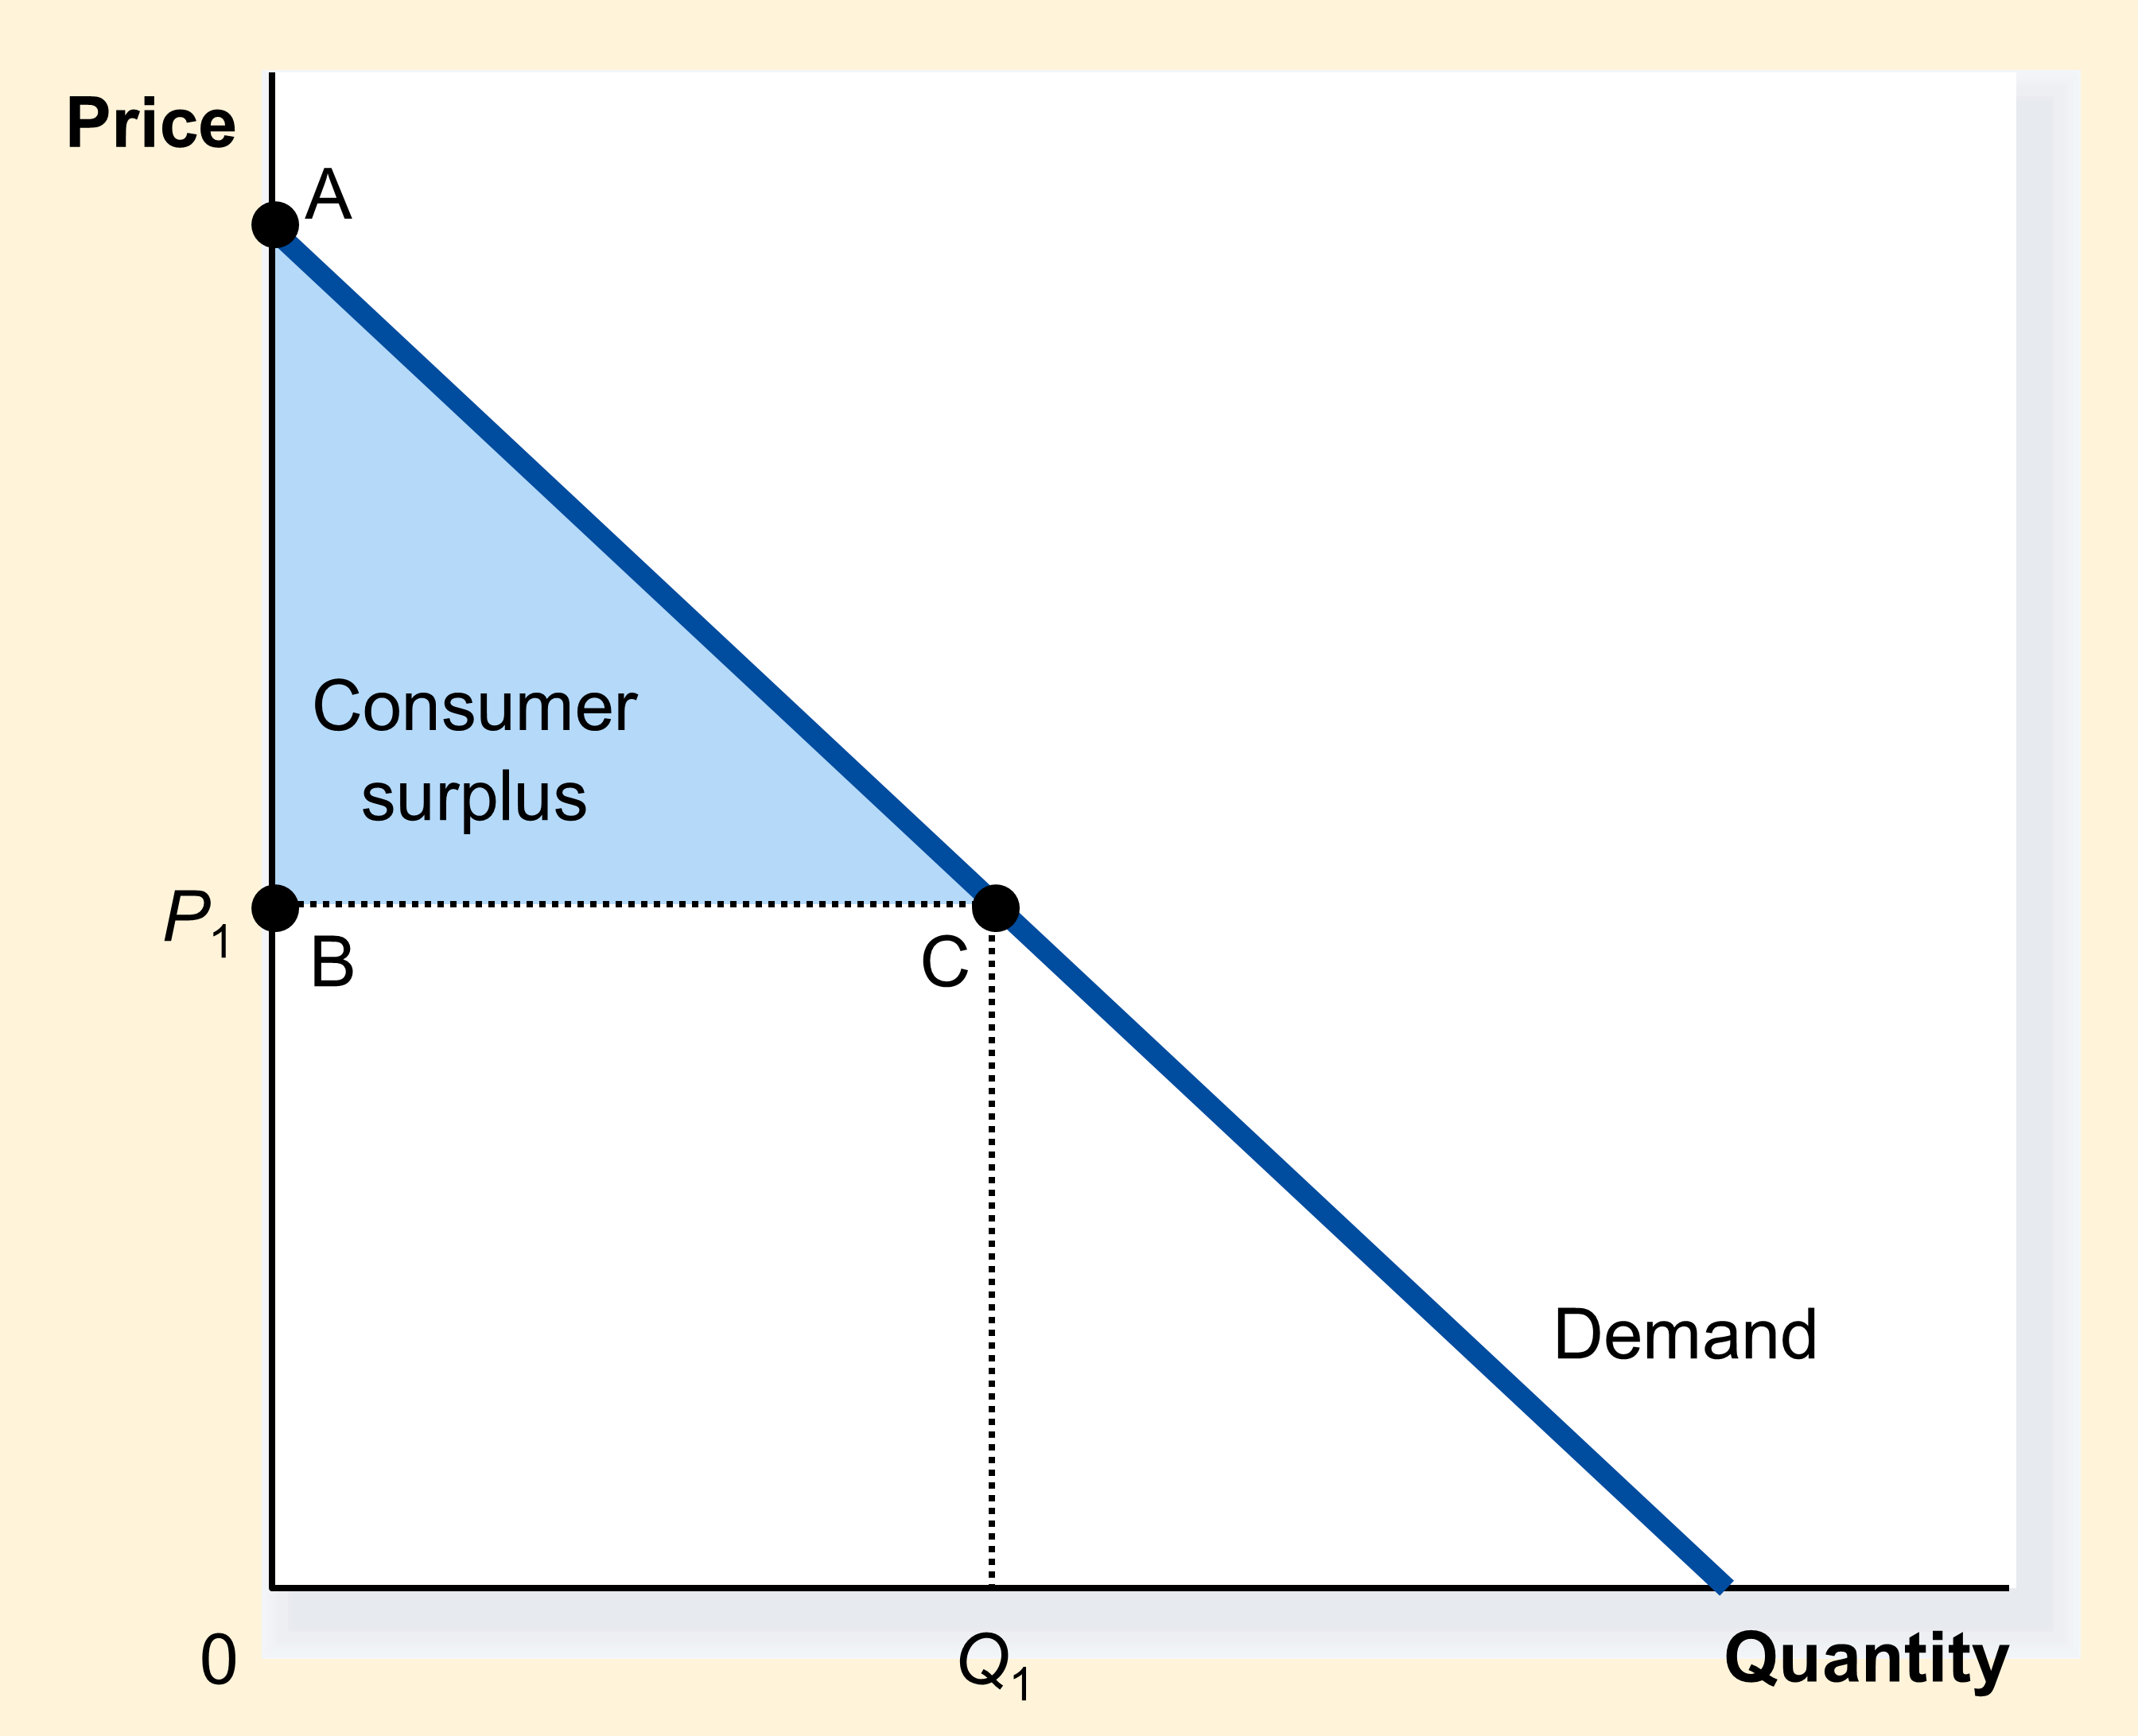
Consumer Surplus, the amount that buyers are willing to pay for a good minus the amount they actually pay for it (), measures the benefit that buyers receive from a good as they themselves perceive it.
Consumer Surplus in Depth:
Section titled “Consumer Surplus in Depth:”- : The Demand Curve, (D), tells us how much people are “Willing To Pay” (WTP) for the good. In other words, it tells us the value that people assign to the good. In economics we trust that the only person who knows the benefit that you get from a good (Marginal Benefit = MB) is you, and that we can best assess that benefit by looking at how much you are willing to pay (Willingness to Pay = WTP). Therefore,
- Therefore,
- Practically, CS is area: (illustration to below ↓)
- below Demand curve
- above Price Line
- to left of quantity that consumers actually consume.
Price and Consumer Surplus: Consumer Surplus When Price Goes Down from P1 to P2
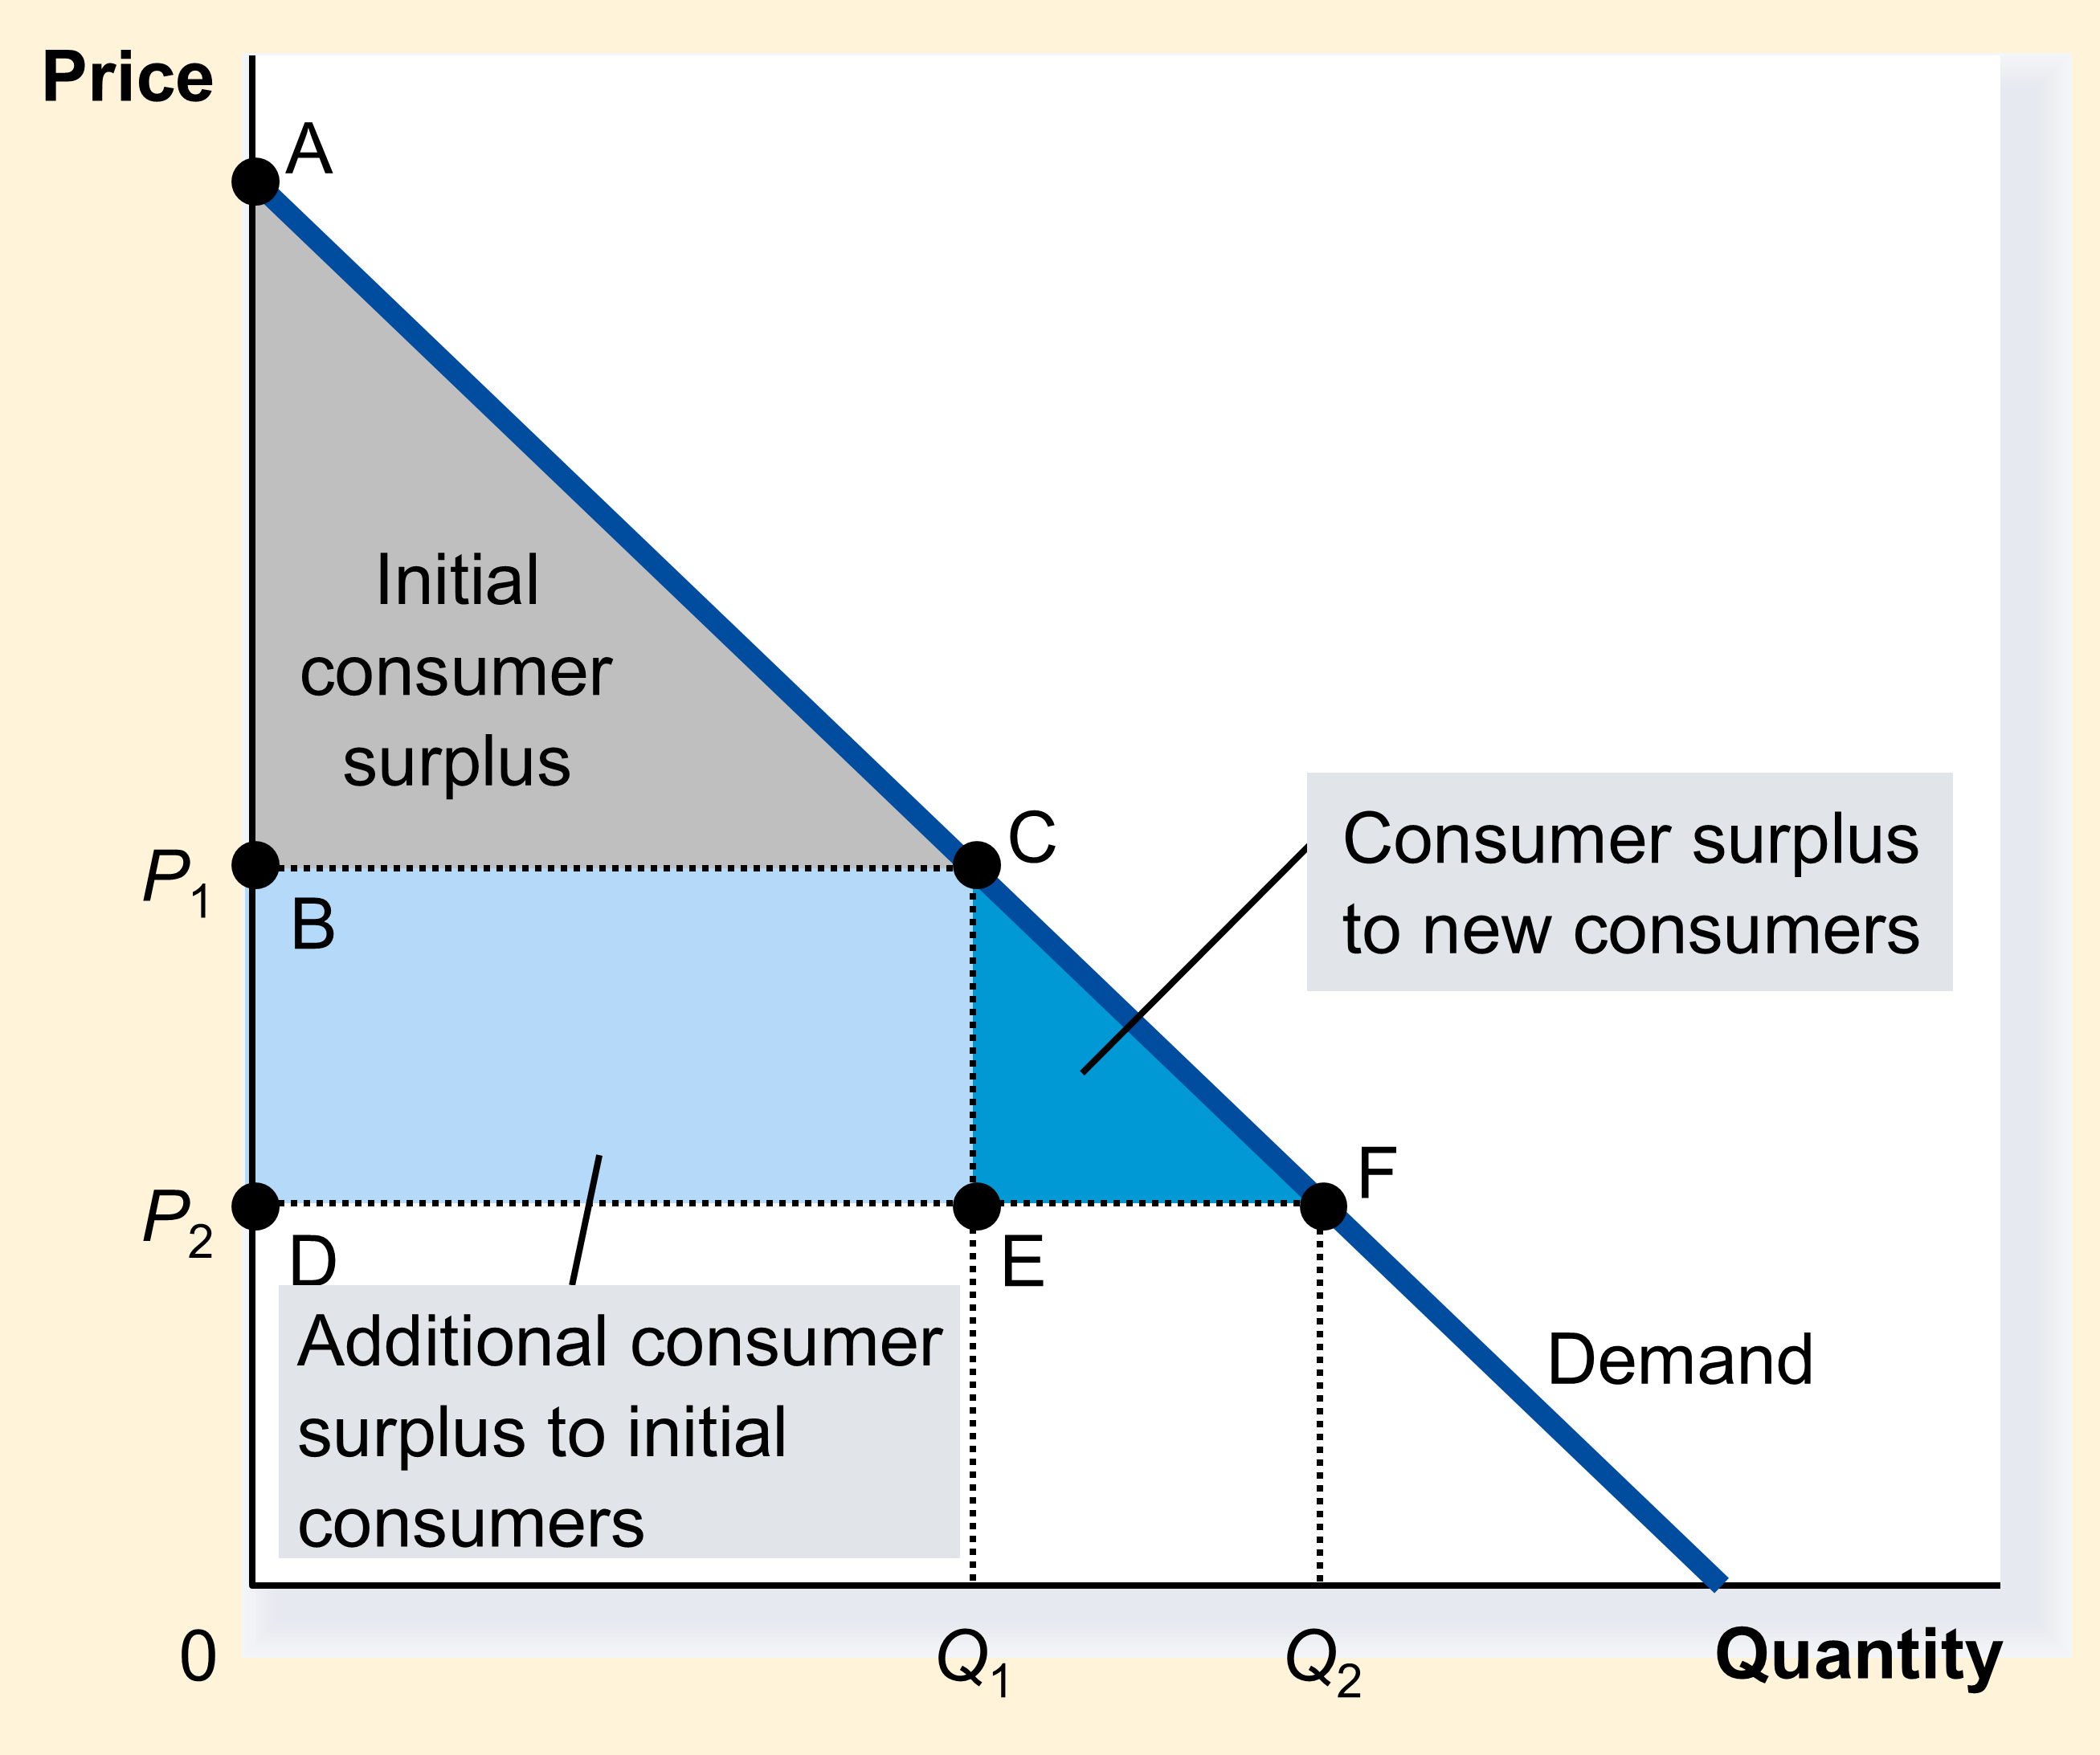
The first Q1 consumers were already consuming the good, so their consumer surplus increases because of the lower price. The remaining consumers, from Q1 to Q2, weren’t consuming before, but choose to consume now that the price is lower.
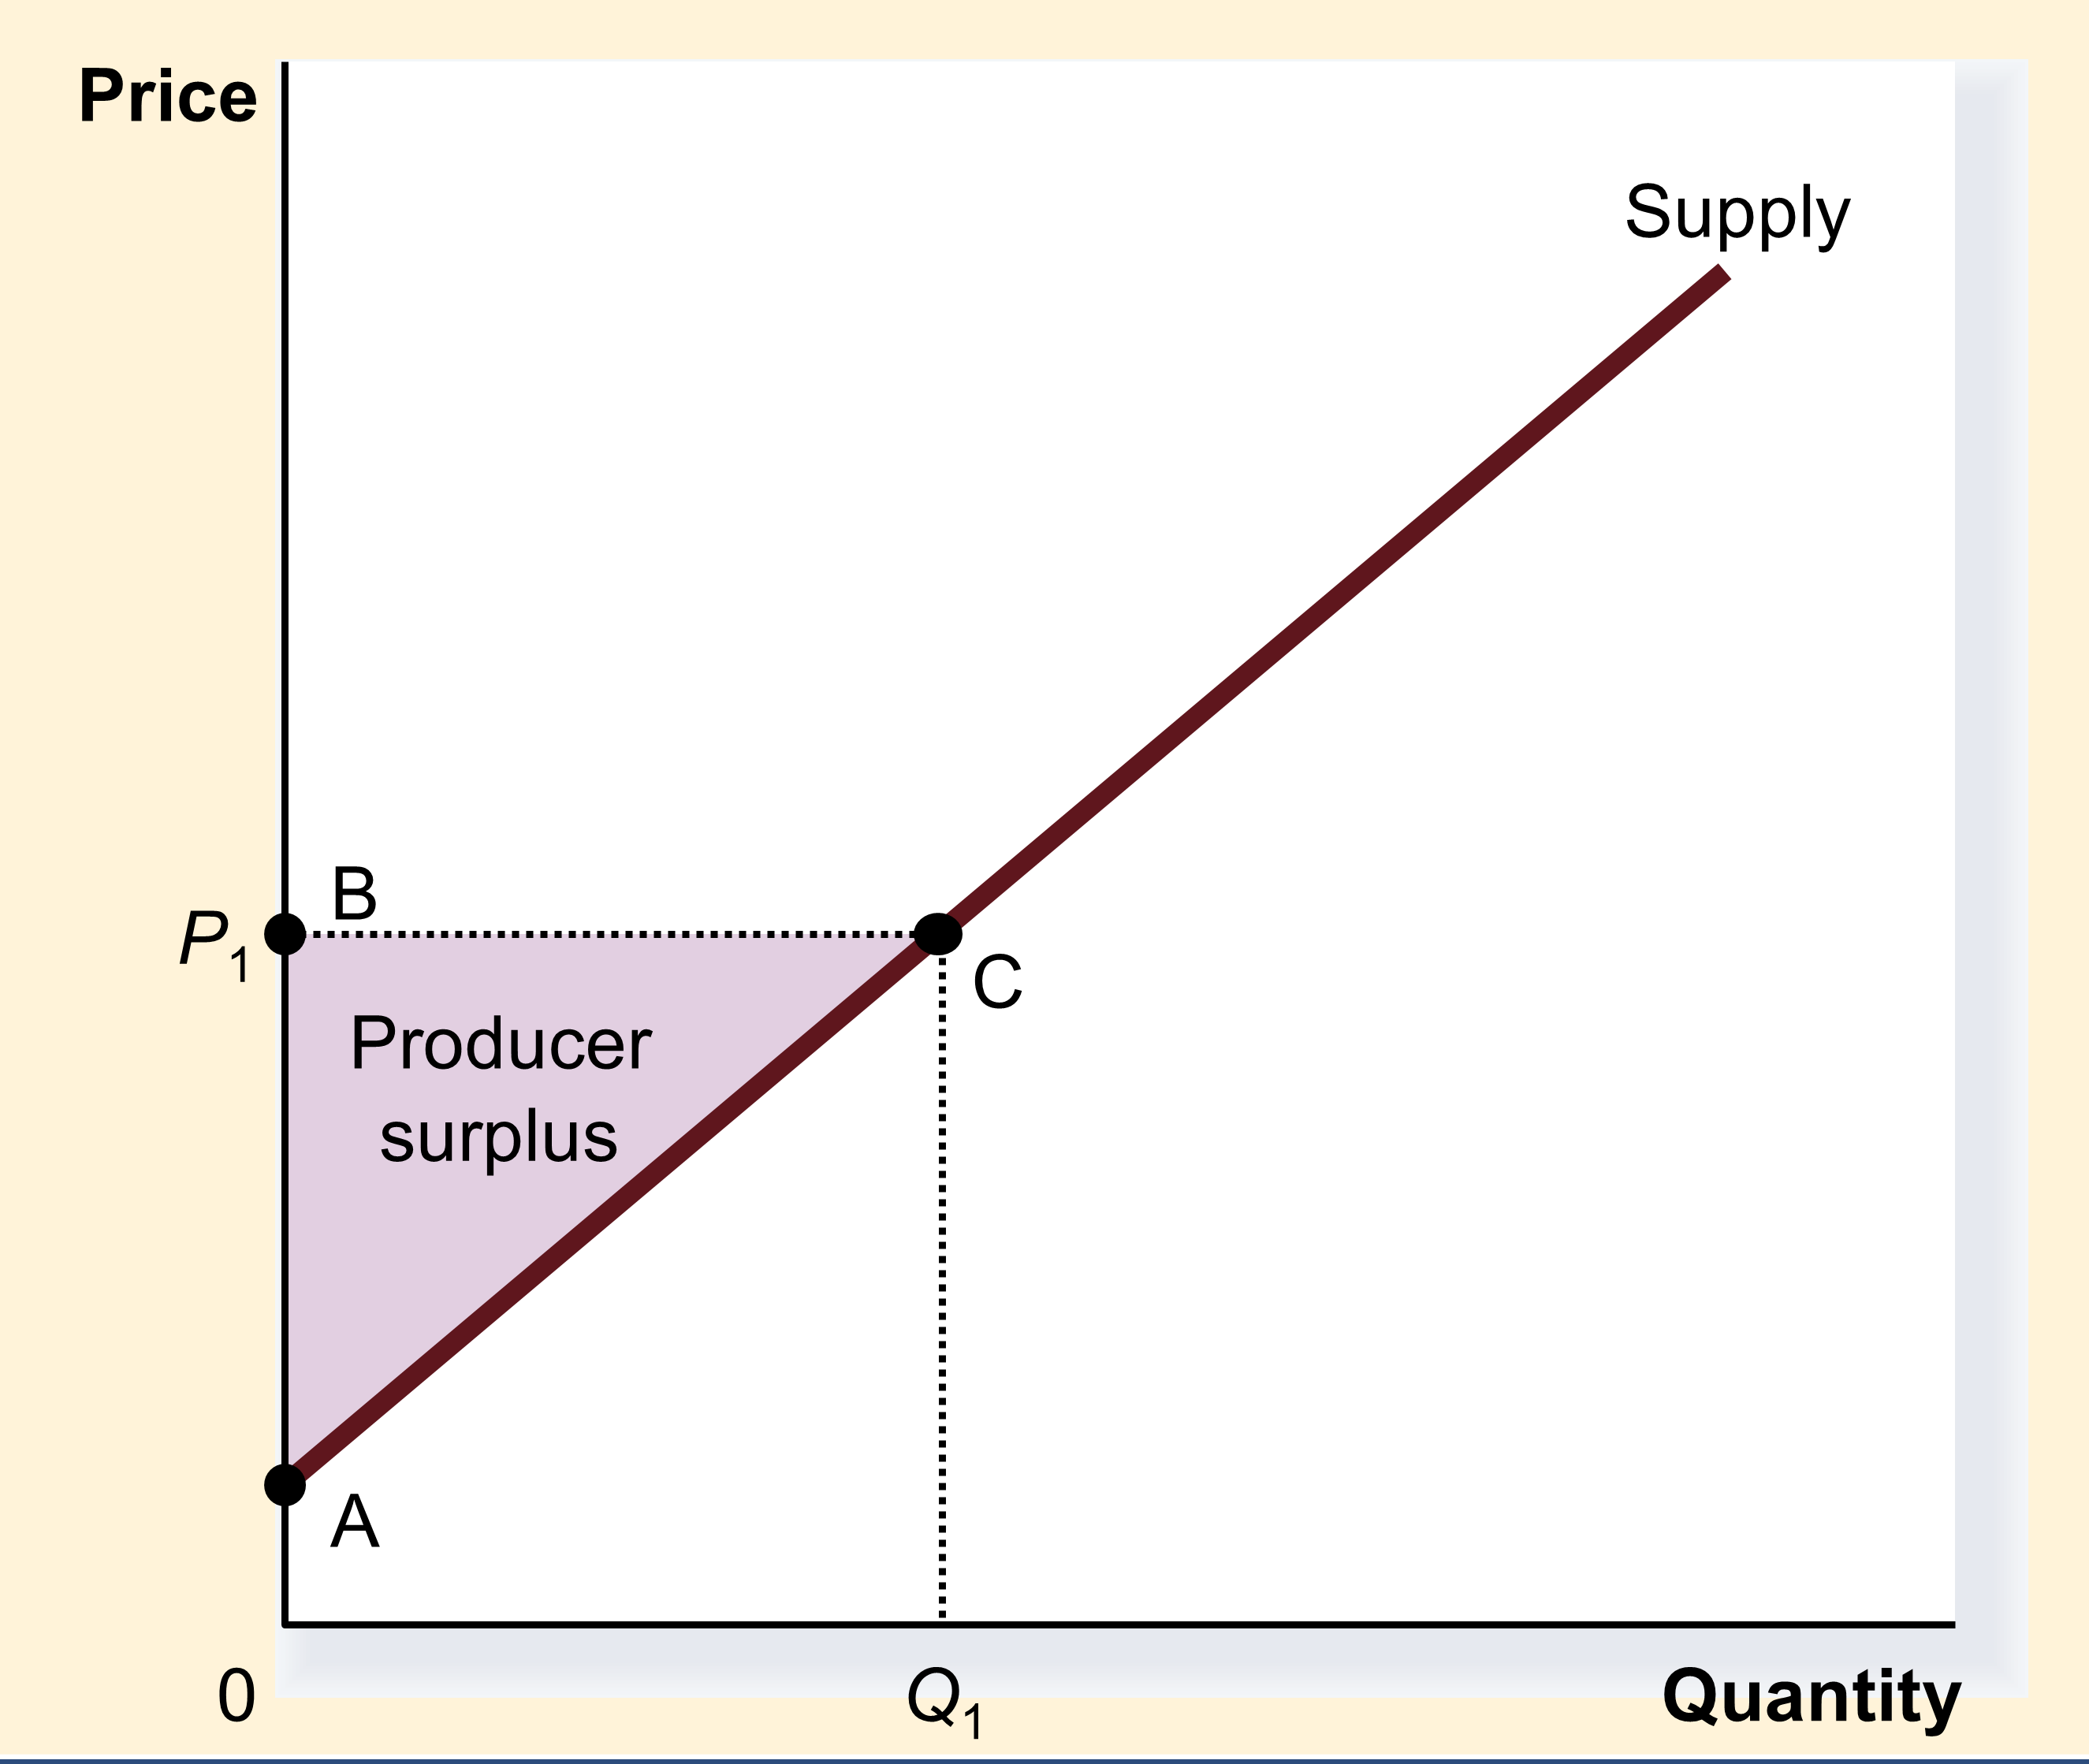
Producer surplus is the amount that sellers receive for a good over and above the minimum for which they are willing to sell the good. The minimum for which they are willing to sell the good is their marginal cost, and is given by their supply curve.
Producer Surplus in Depth
Section titled “Producer Surplus in Depth”- : The supply curve tells us the lowest price they are Willing To Accept (WTA). Willingness to Accept is driven by a firm’s cost, so it also tells us their Marginal Cost (MC). Therefore, .
- Therefore,
- This is the profit that they make by selling that unit.
- Practically, PS is area: (illustration to right →)
- above Supply curve
- below Price Line
- to left of quantity that producers actually produce.
Price and Producer Surplus: Producer Surplus When Price Goes Up from P1 to P2
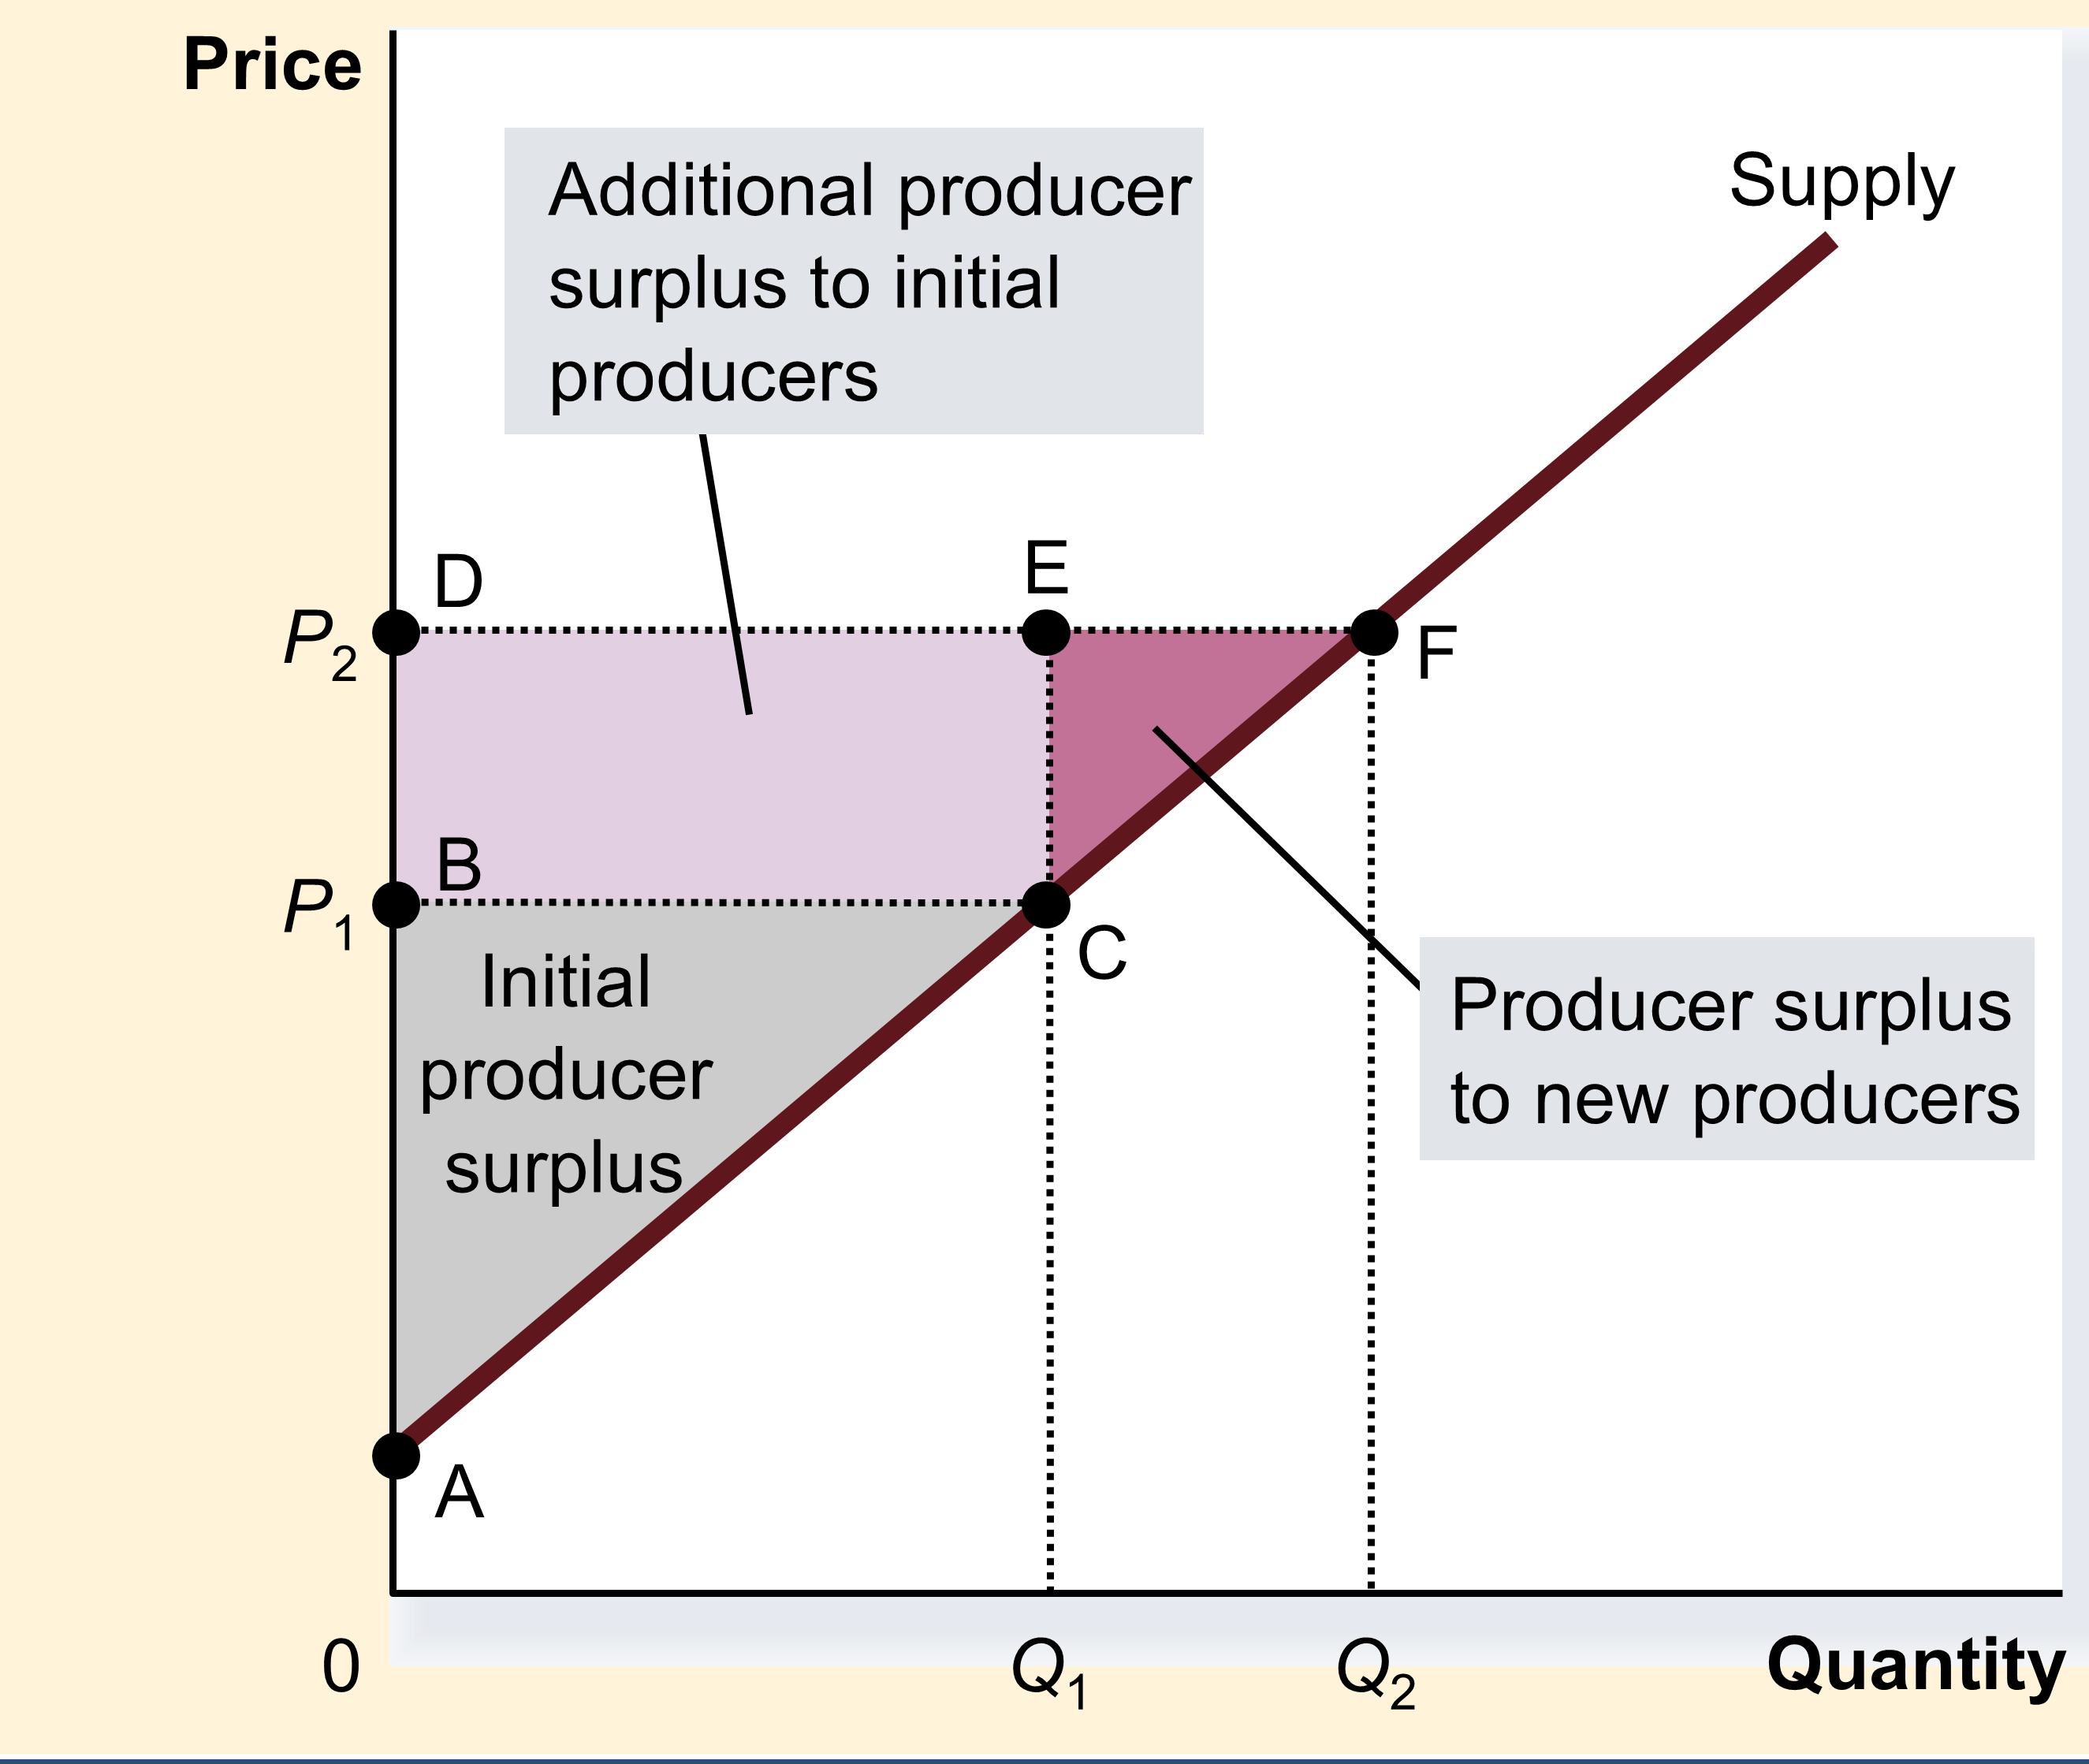
As the price rises, the first Q1 producers were already selling the good, so they benefit from the higher price. The remaining producers, from Q1 to Q2, weren’t selling before, but get into the market because of the higher price.
Total Surplus and Efficiency
Section titled “Total Surplus and Efficiency”
Recall, from the very first lecture of this course, The Central Questions of Economics:
- What gets produced? (firms choose quantities or shut down, etc.)
- How does it get produced? (which firm produces it)
- Who gets what is produced? (demand) In other words, how does a society deal with scarcity?
(Economic) Efficiency means that you are maximizing total surplus.
In a market system, all of the units that increase social surplus will be produced. Further, they will be produced by the lowest cost producers and given to the people with the highest willingness to pay. In other words, a market system replicates what an Omniscient Planner would do:
The Omniscient Planner
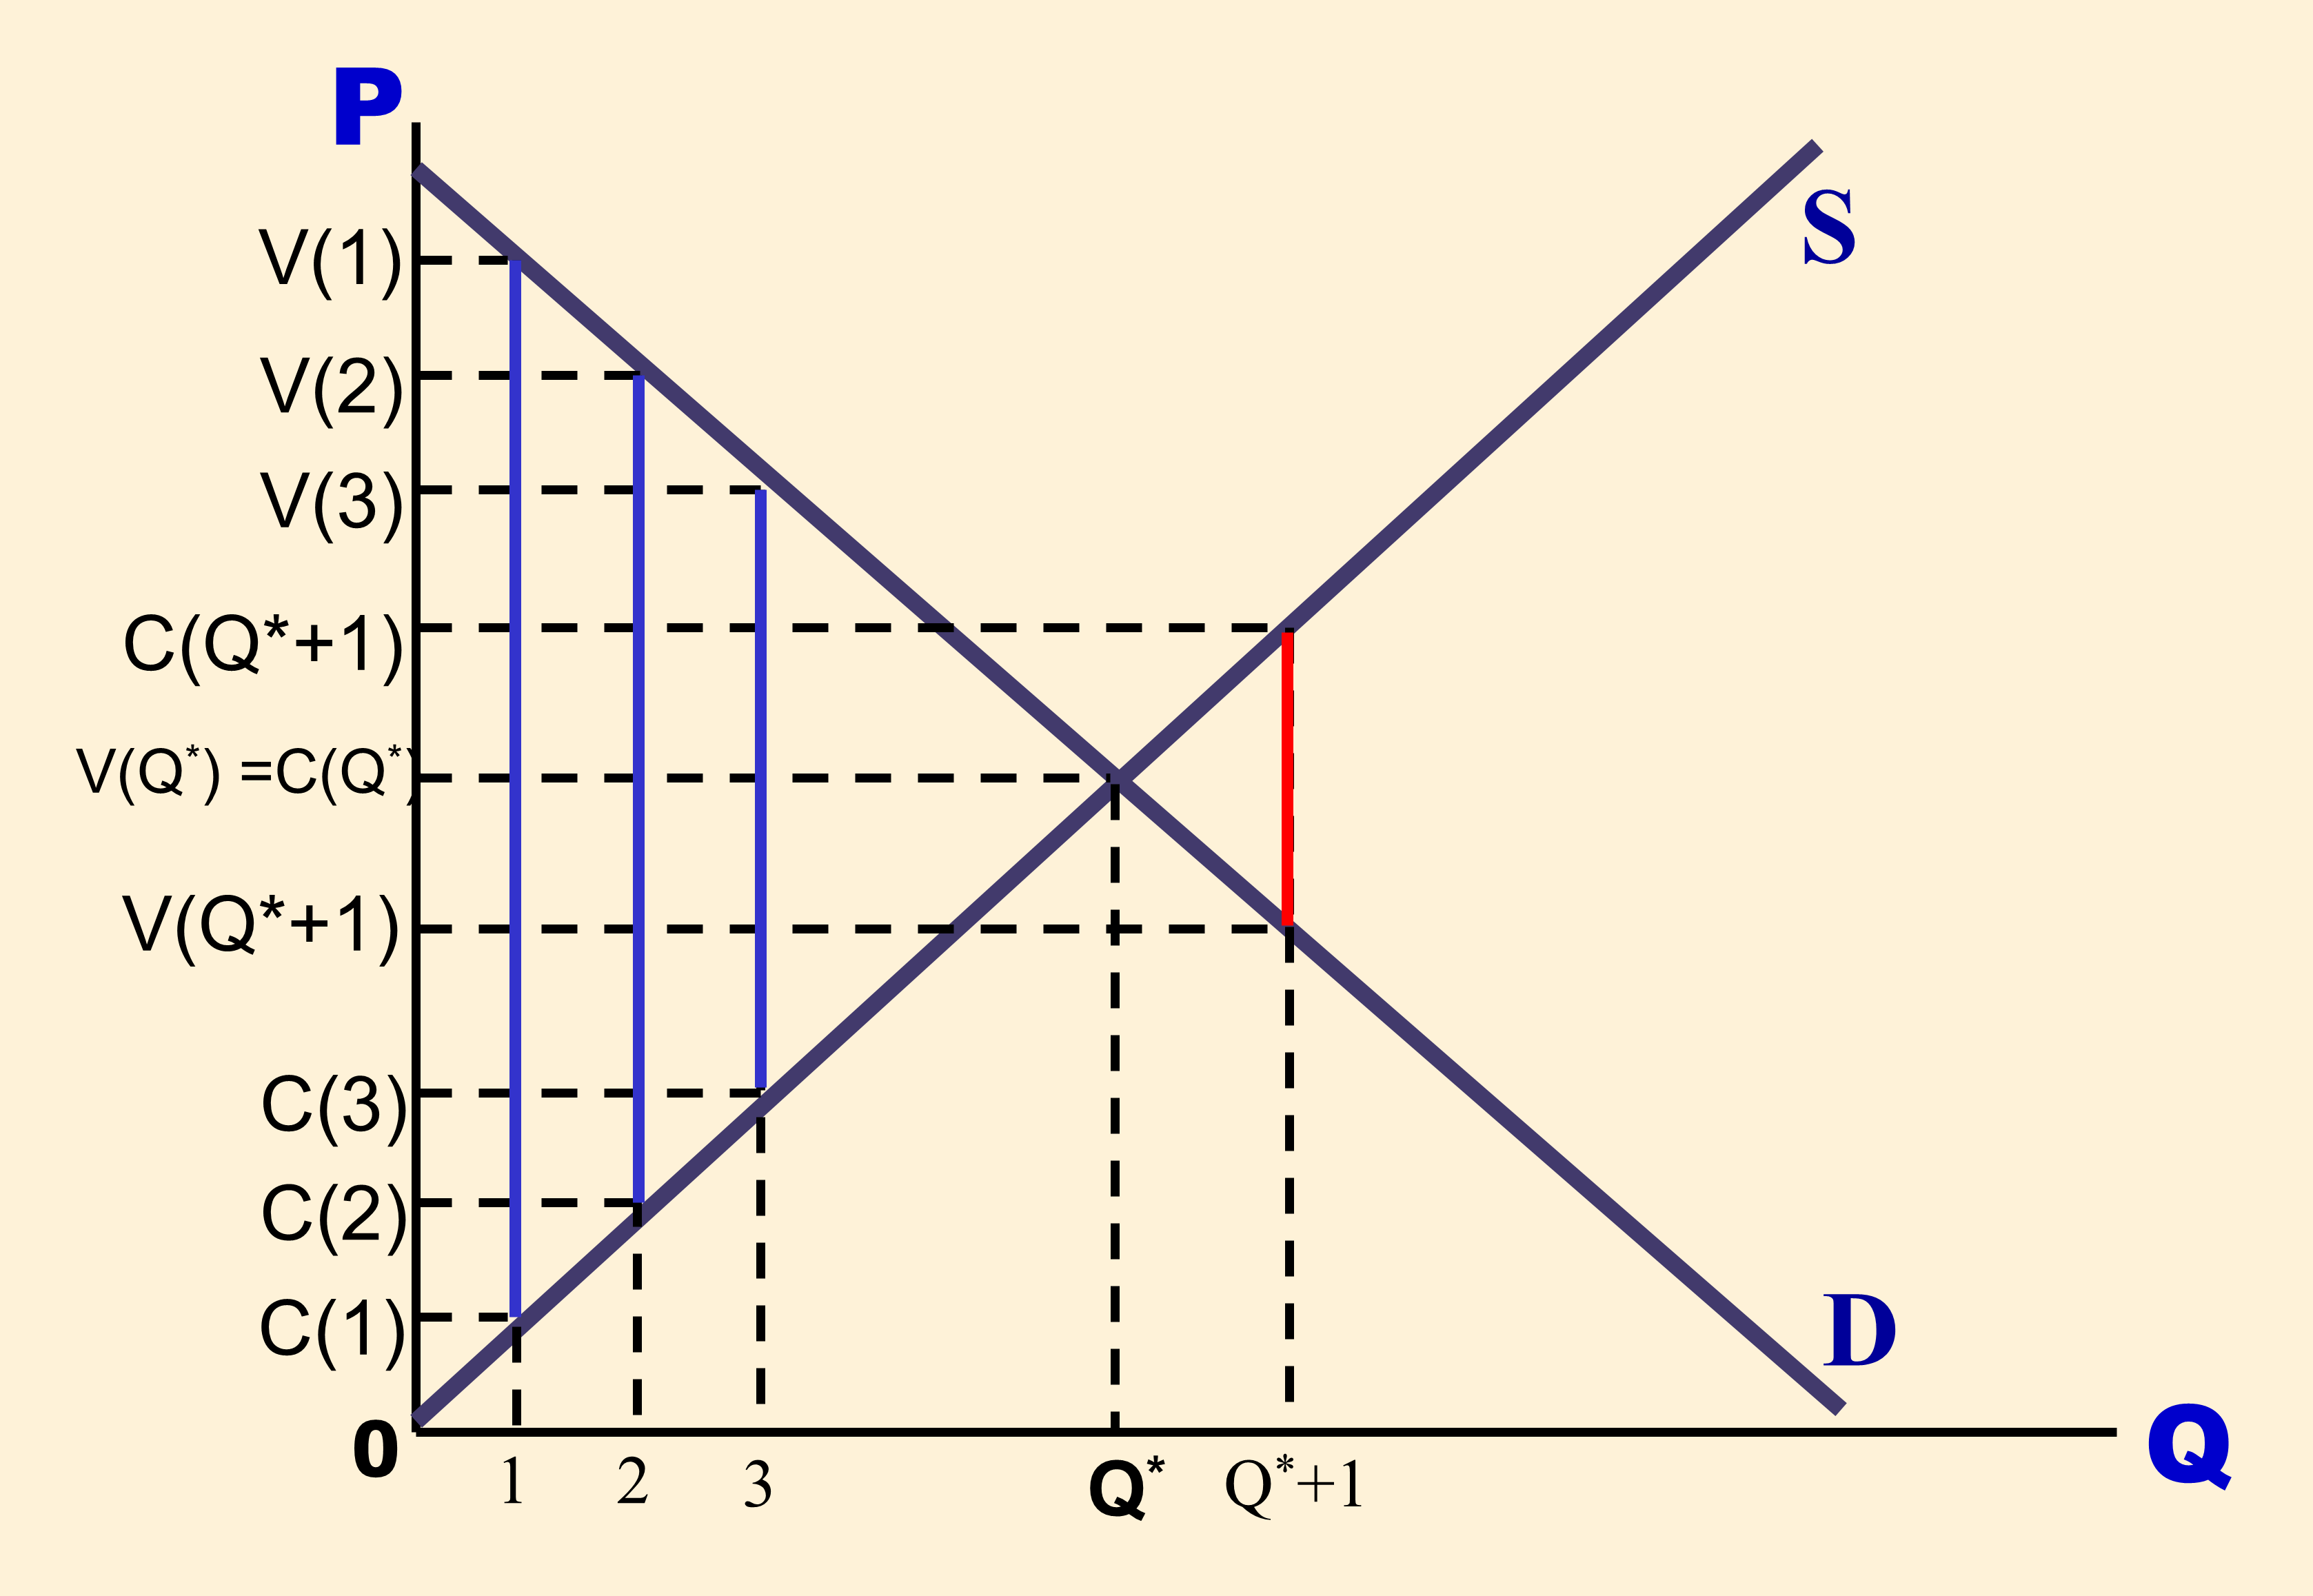
We can analyze efficiency by looking at each unit that is sold.
First unit sold:
- - The value of the first unit to society is the value that the first consumer gets
- - The costs to society of the first good are the costs of the first producer.
- Do the benefits outweigh the costs? Yes, a lot, by . THE OMNISCIENT PLANNER FEELS THAT THIS UNIT SHOULD BE PRODUCED.
- Why doesn’t price matter to the Omniscient Planner? Because payments are a transfer from one person to the other. The consumer is $P poorer and the seller is $P richer. These two effects. P P
- Blue lines increase surplus.
The above applies for all units sold until unit . At unit .
For every unit sold after :
- . Because the costs are greater than the benefits, social surplus declines. THE OMNISCIENT BENEVOLENT PLANNER FEELS THAT THIS UNIT SHOULD NOT BE PRODUCED.
- Red lines
The argument here is that centrally planned economies are not effective, because even if the planner were omniscient, they would make the same amount of goods as a market based system.
In contrast, in market based systems, price acts as an invisible hand to make sure we reach the efficient allocation. This tendency is sometimes referred to as “the invisible hand.”
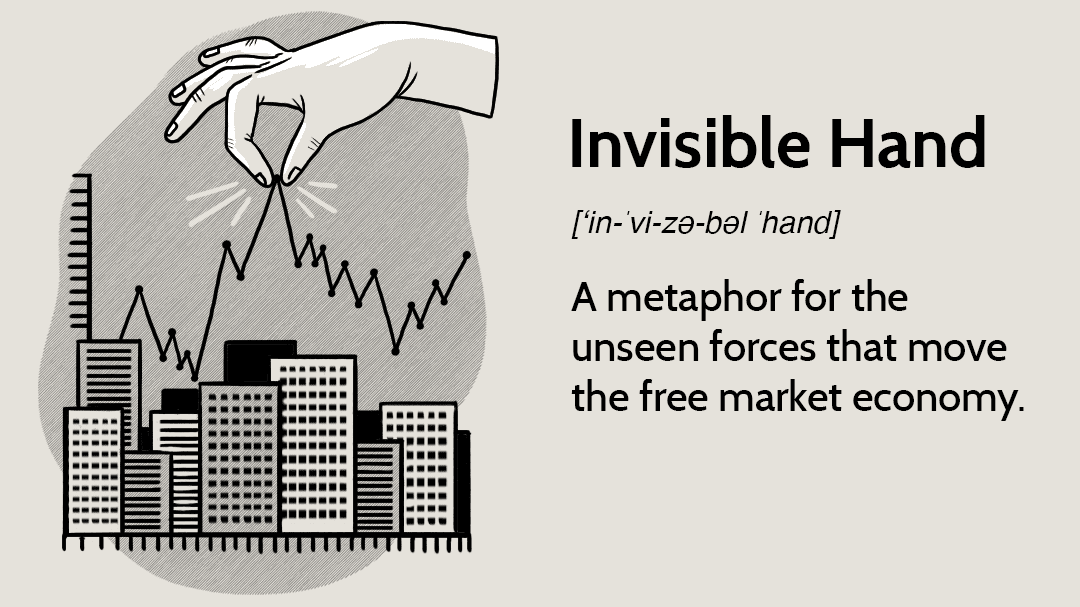
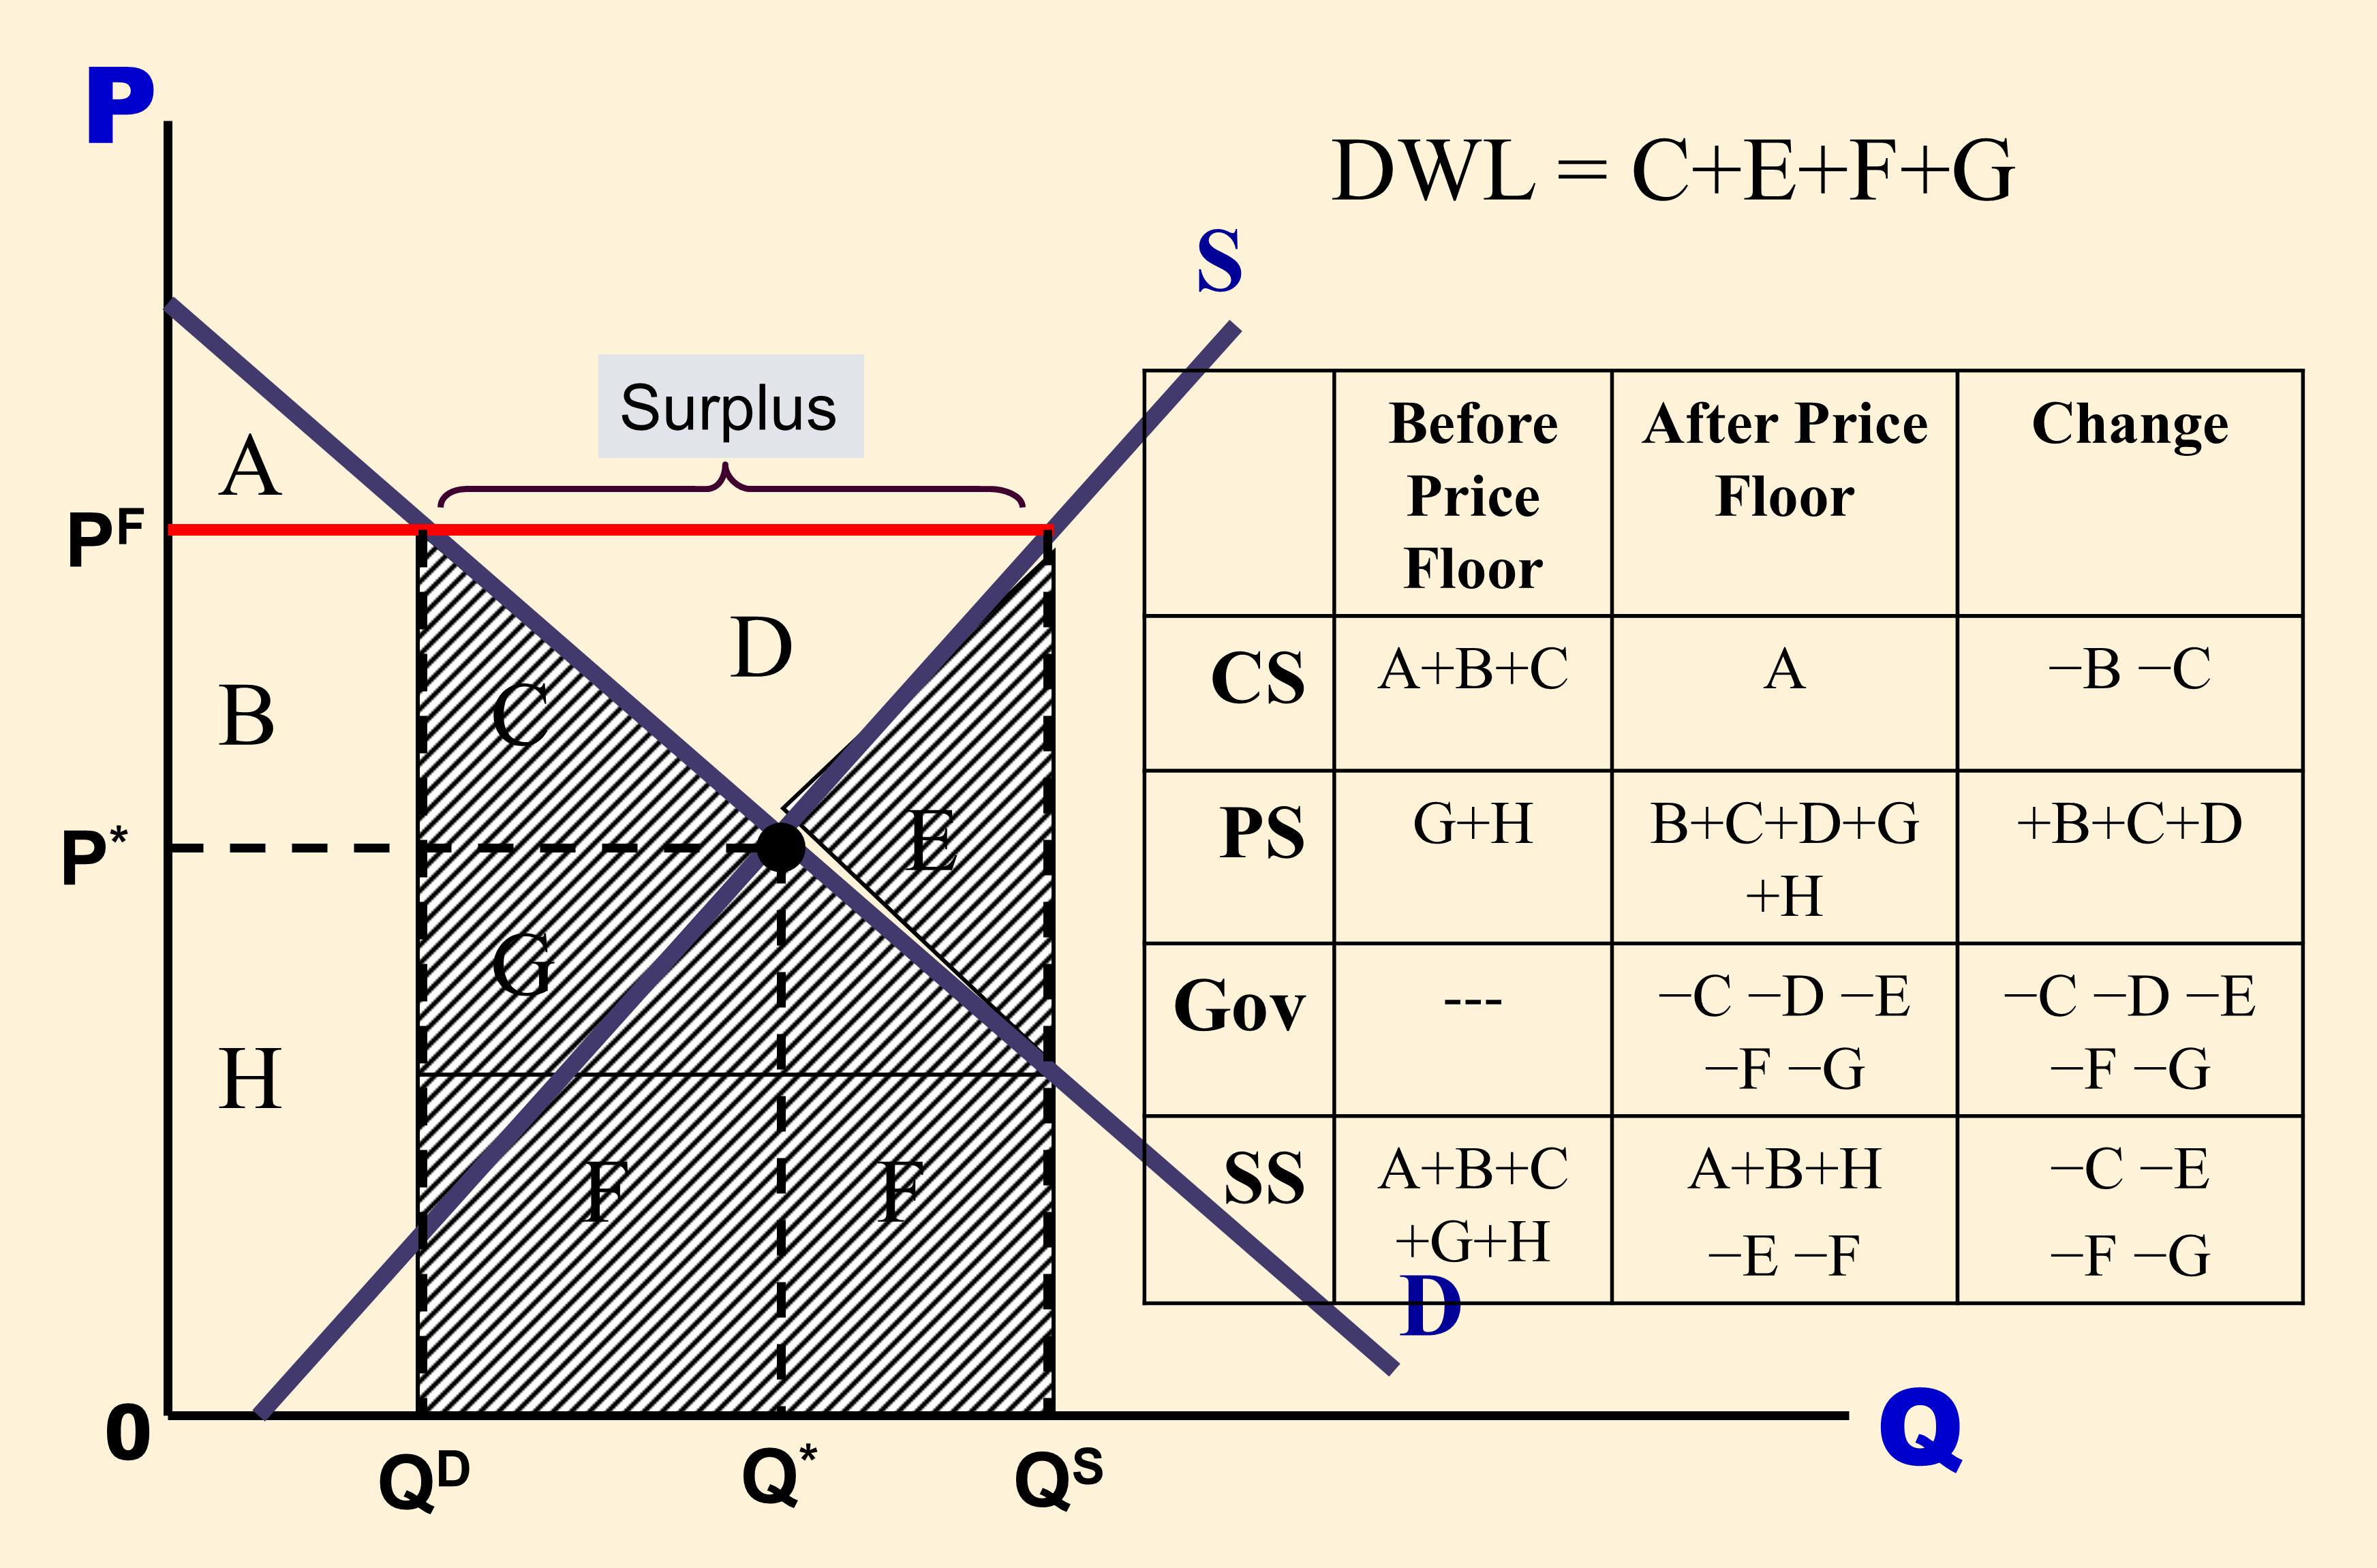
As seen above, competitive markets maximize Total Surplus. In contrast, price floors and price ceilings (whether the government buys the surplus or not) reduce Total Surplus. This waste of total surplus is known as “Deadweight Loss” from the government intervention.
Market Efficiency
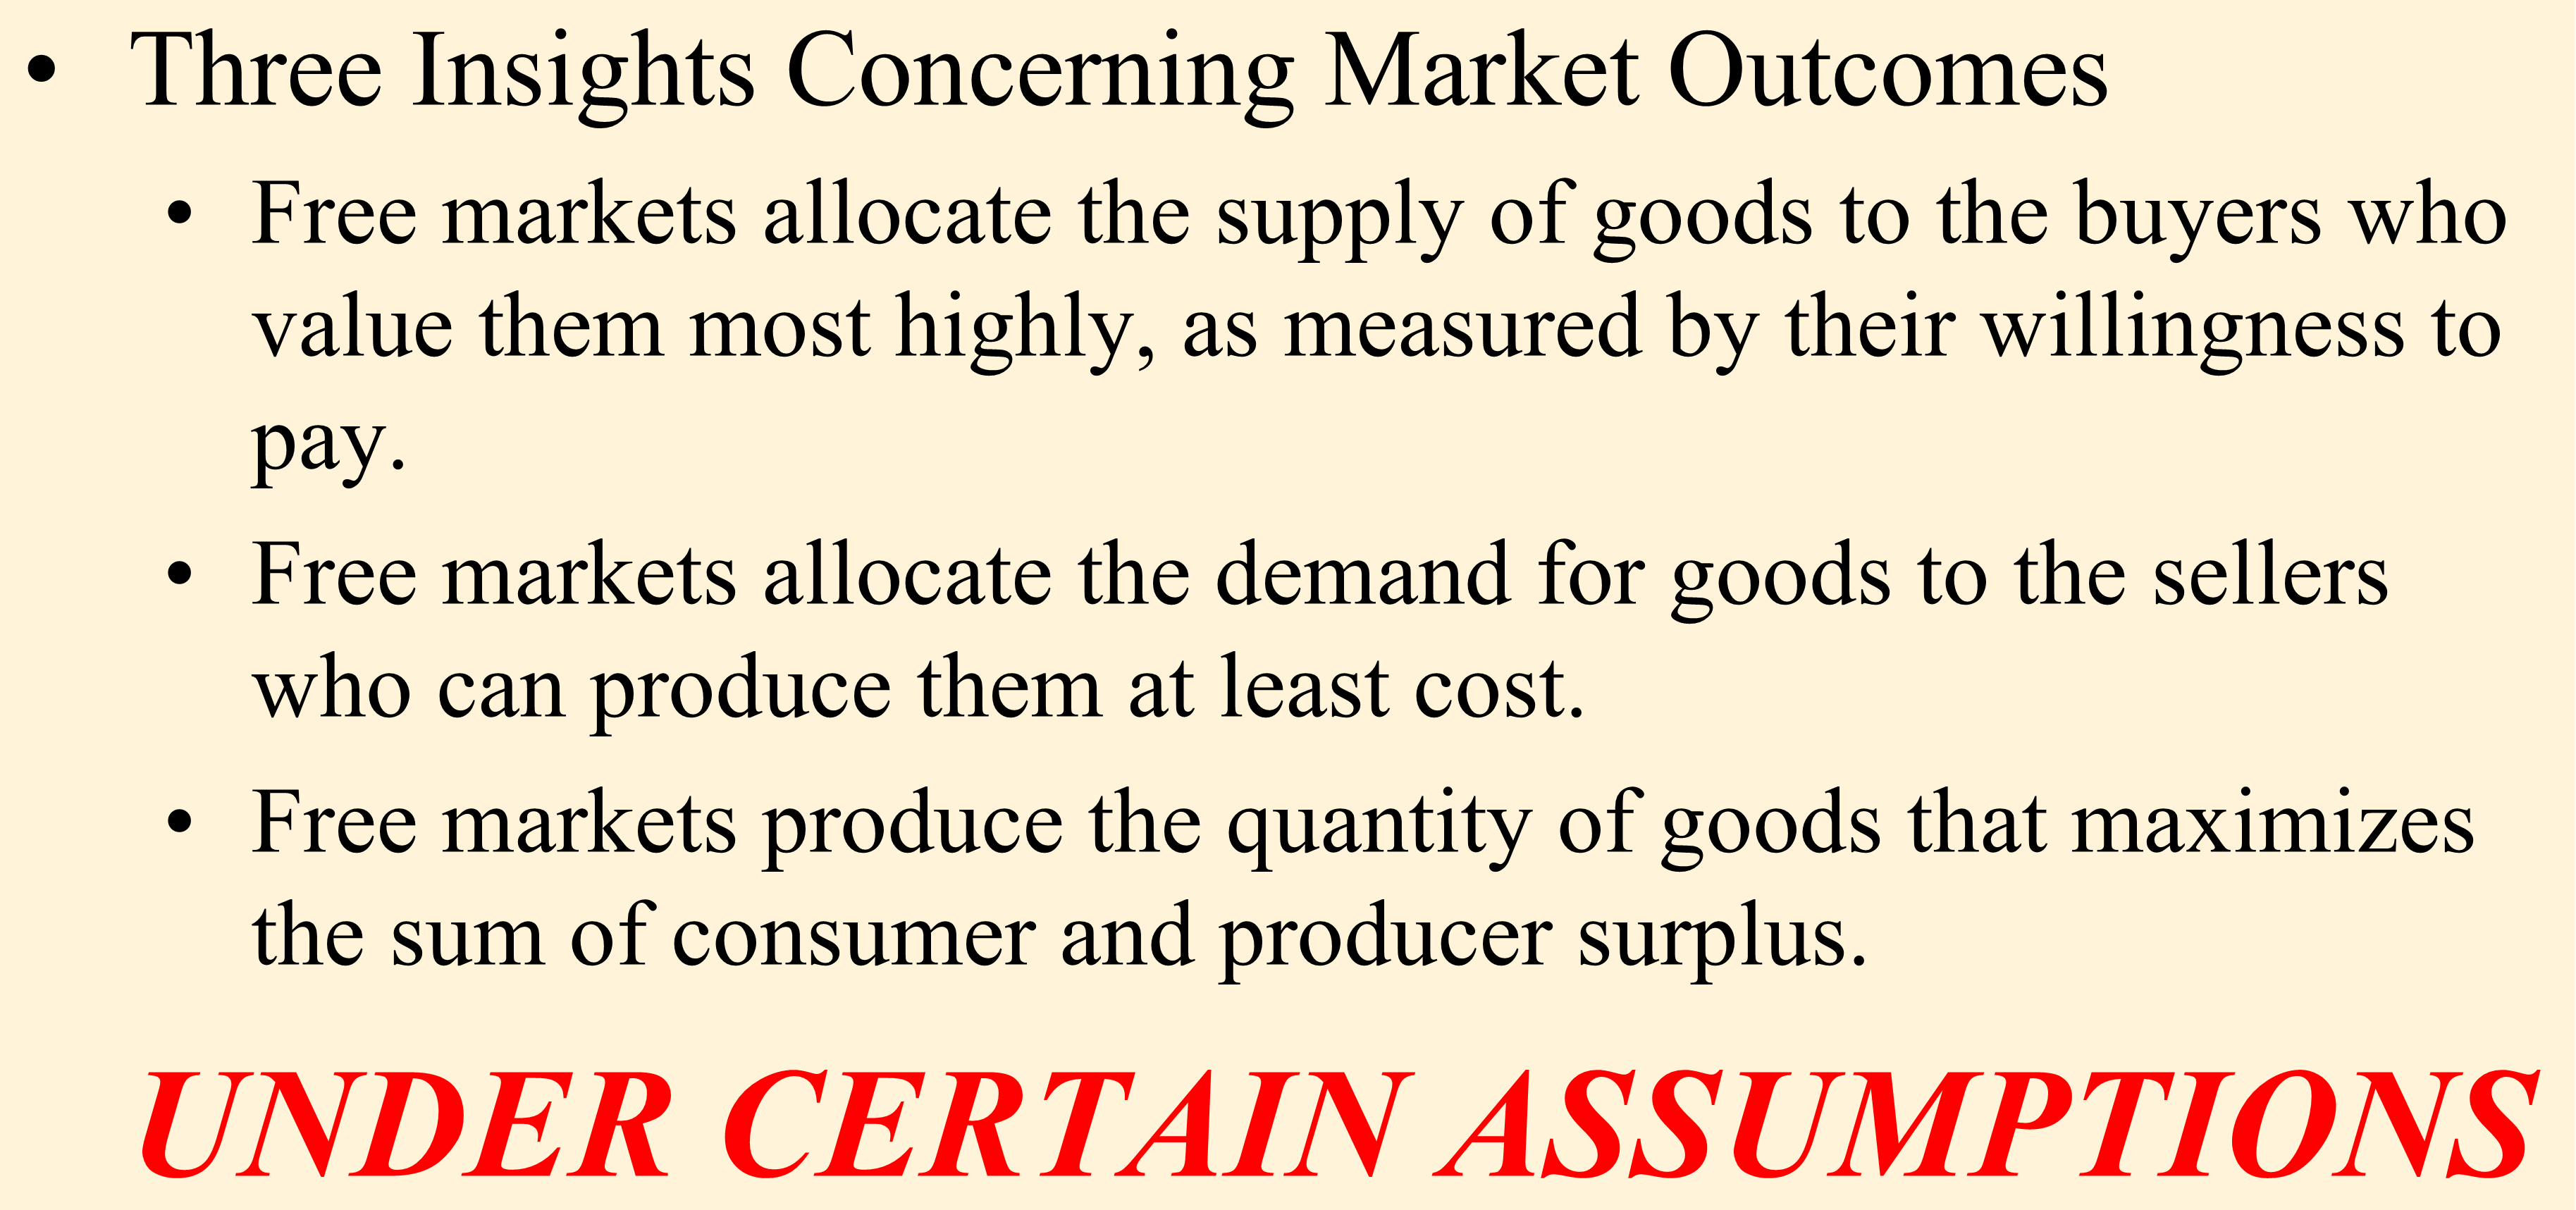
In Lecture 1, we identified three Central Questions of economics:
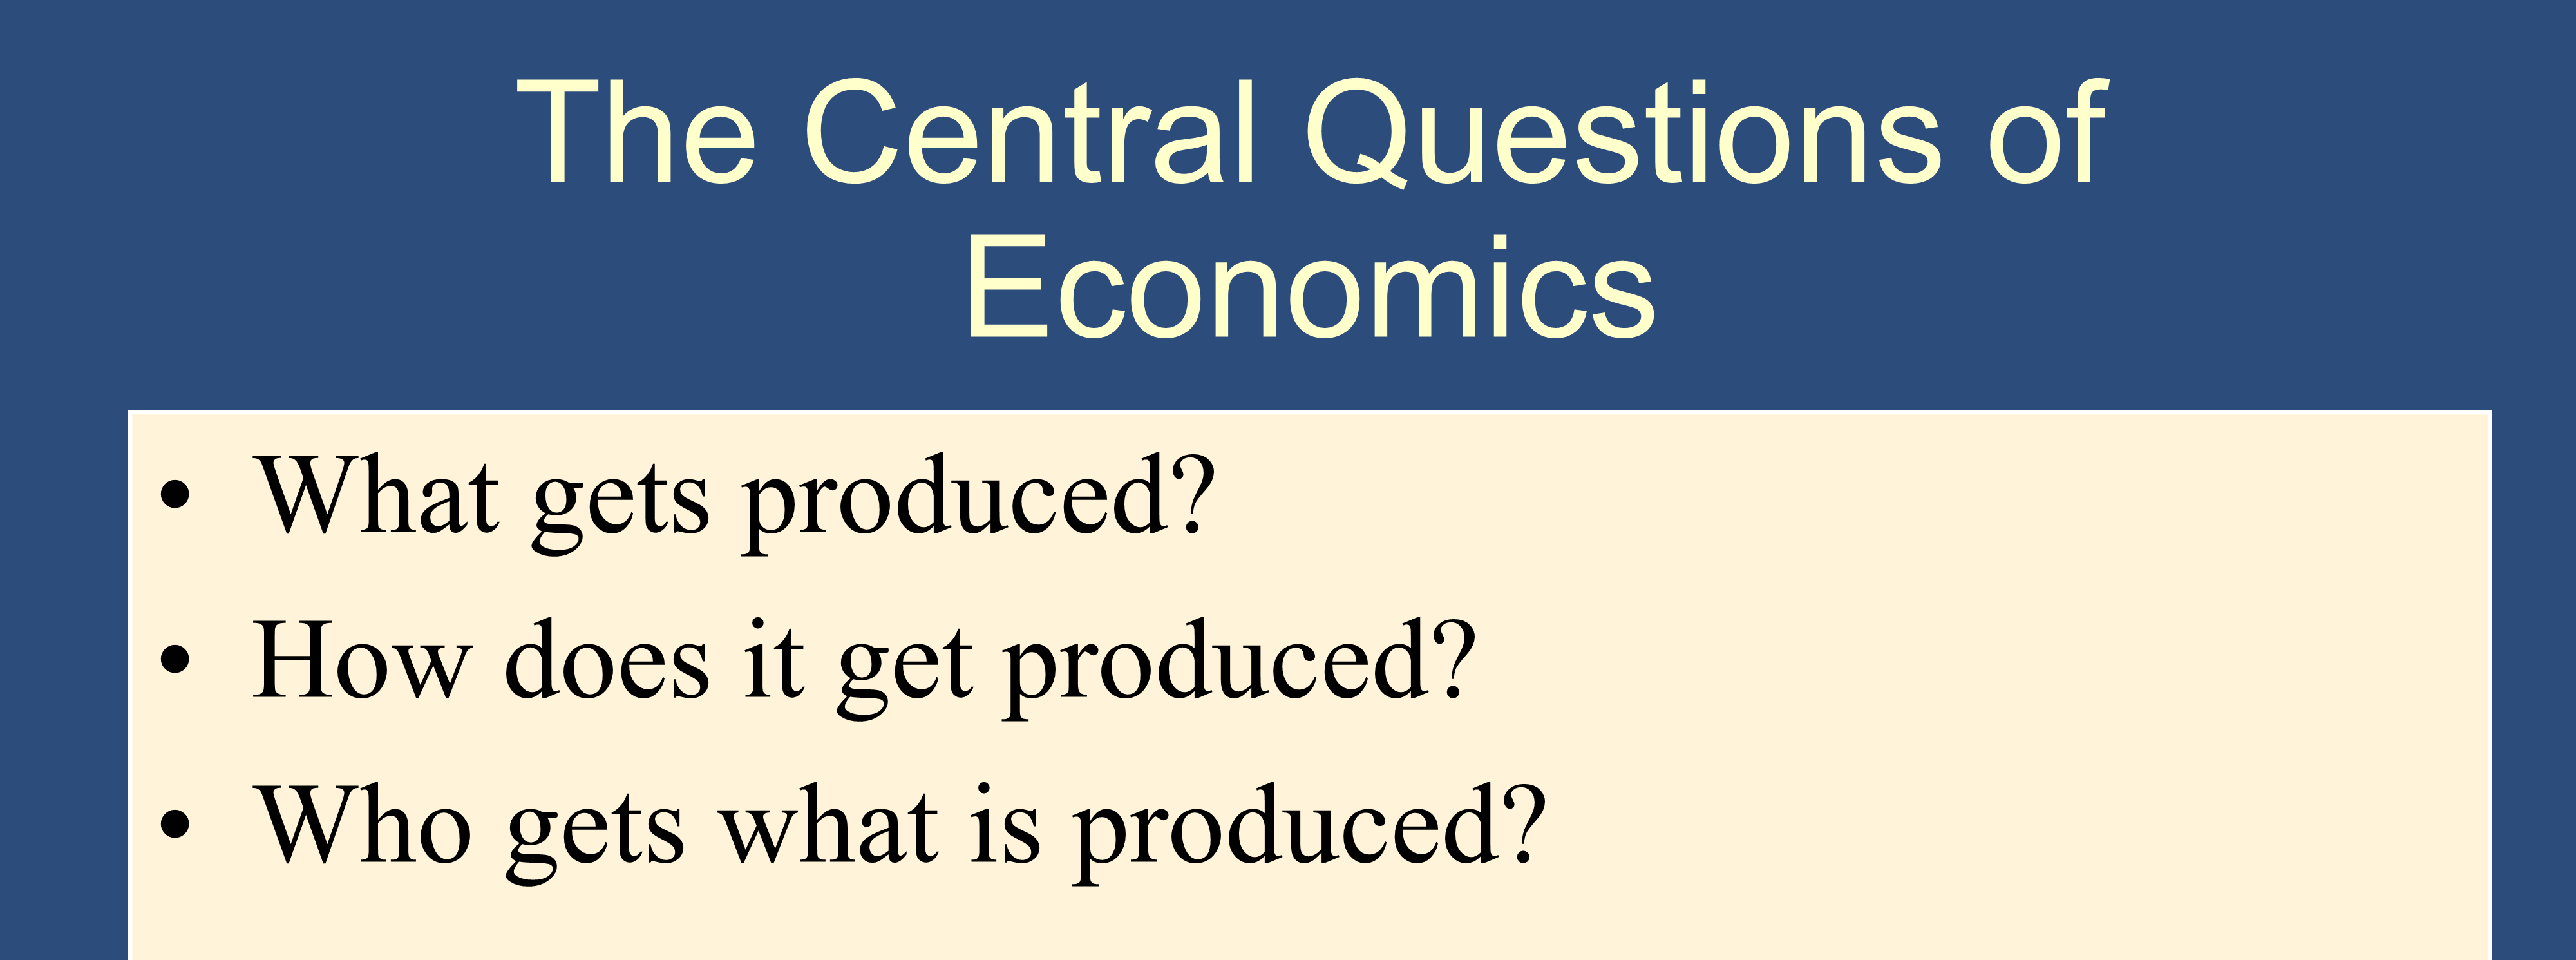
The “Market Efficiency” slide, above, shows that ideal Competitive markets accomplish aspects of all three of these goals perfectly:
-
What gets produced?
- Free markets produce the quantity of goods that maximizes the sum of consumer and producer surplus (ie they produce the right amount of the right goods and do this more effectively than any other system we know of)
-
How does it get produced?
- Free markets allocate the demand for goods to the sellers who can produce them at least cost (also, sellers have an incentive to minimize their costs to maximize their profits)
-
Who gets what is produced?
- Free markets allocate the supply of goods to the buyers who value them most highly, as measured by their willingness to pay
Pareto Optimality and the First Fundamental Theorem of Welfare Economics
Section titled “Pareto Optimality and the First Fundamental Theorem of Welfare Economics”Intuitively, Pareto efficiency means that there is no way to redistribute goods in a way that everyone is at least as happy as they were before (and at least one person is more happy).
Here is the precise definition:
Pareto Efficiency (or Pareto Optimality) - A situation in which nobody can be made better off without making somebody else worse off.
This means that you can’t set up a system of trades where someone is better off an no one is worse off. Fundamentally, there are many opportunities for trade in life, and you’re not Pareto efficient until all of those trades have happened.
- “Bruce wins the lottery and doesn’t share” is Pareto efficient because to give someone else money would mean that he has less money.
- First Fundamental Welfare Theorem says that any market equilibrium will be Pareto Efficient
Now let’s move on to the downside of free markets:
#1, they rely on several fairly stringent assumptions:
Assumptions Perfect Competition (to be Efficient):
Section titled “Assumptions Perfect Competition (to be Efficient):”- Many buyers and sellers
- Buyers and sellers are well informed
- Property rights are well-defined
(If these three conditions hold, a market is called “perfectly competitive”).
#2, Market systems may not be equitable (fair).
In addition to market efficiency, a social planner might also care about equity - the fairness of the distribution of well-being among the various buyers and sellers.
Welfare Analysis of Price Ceiling
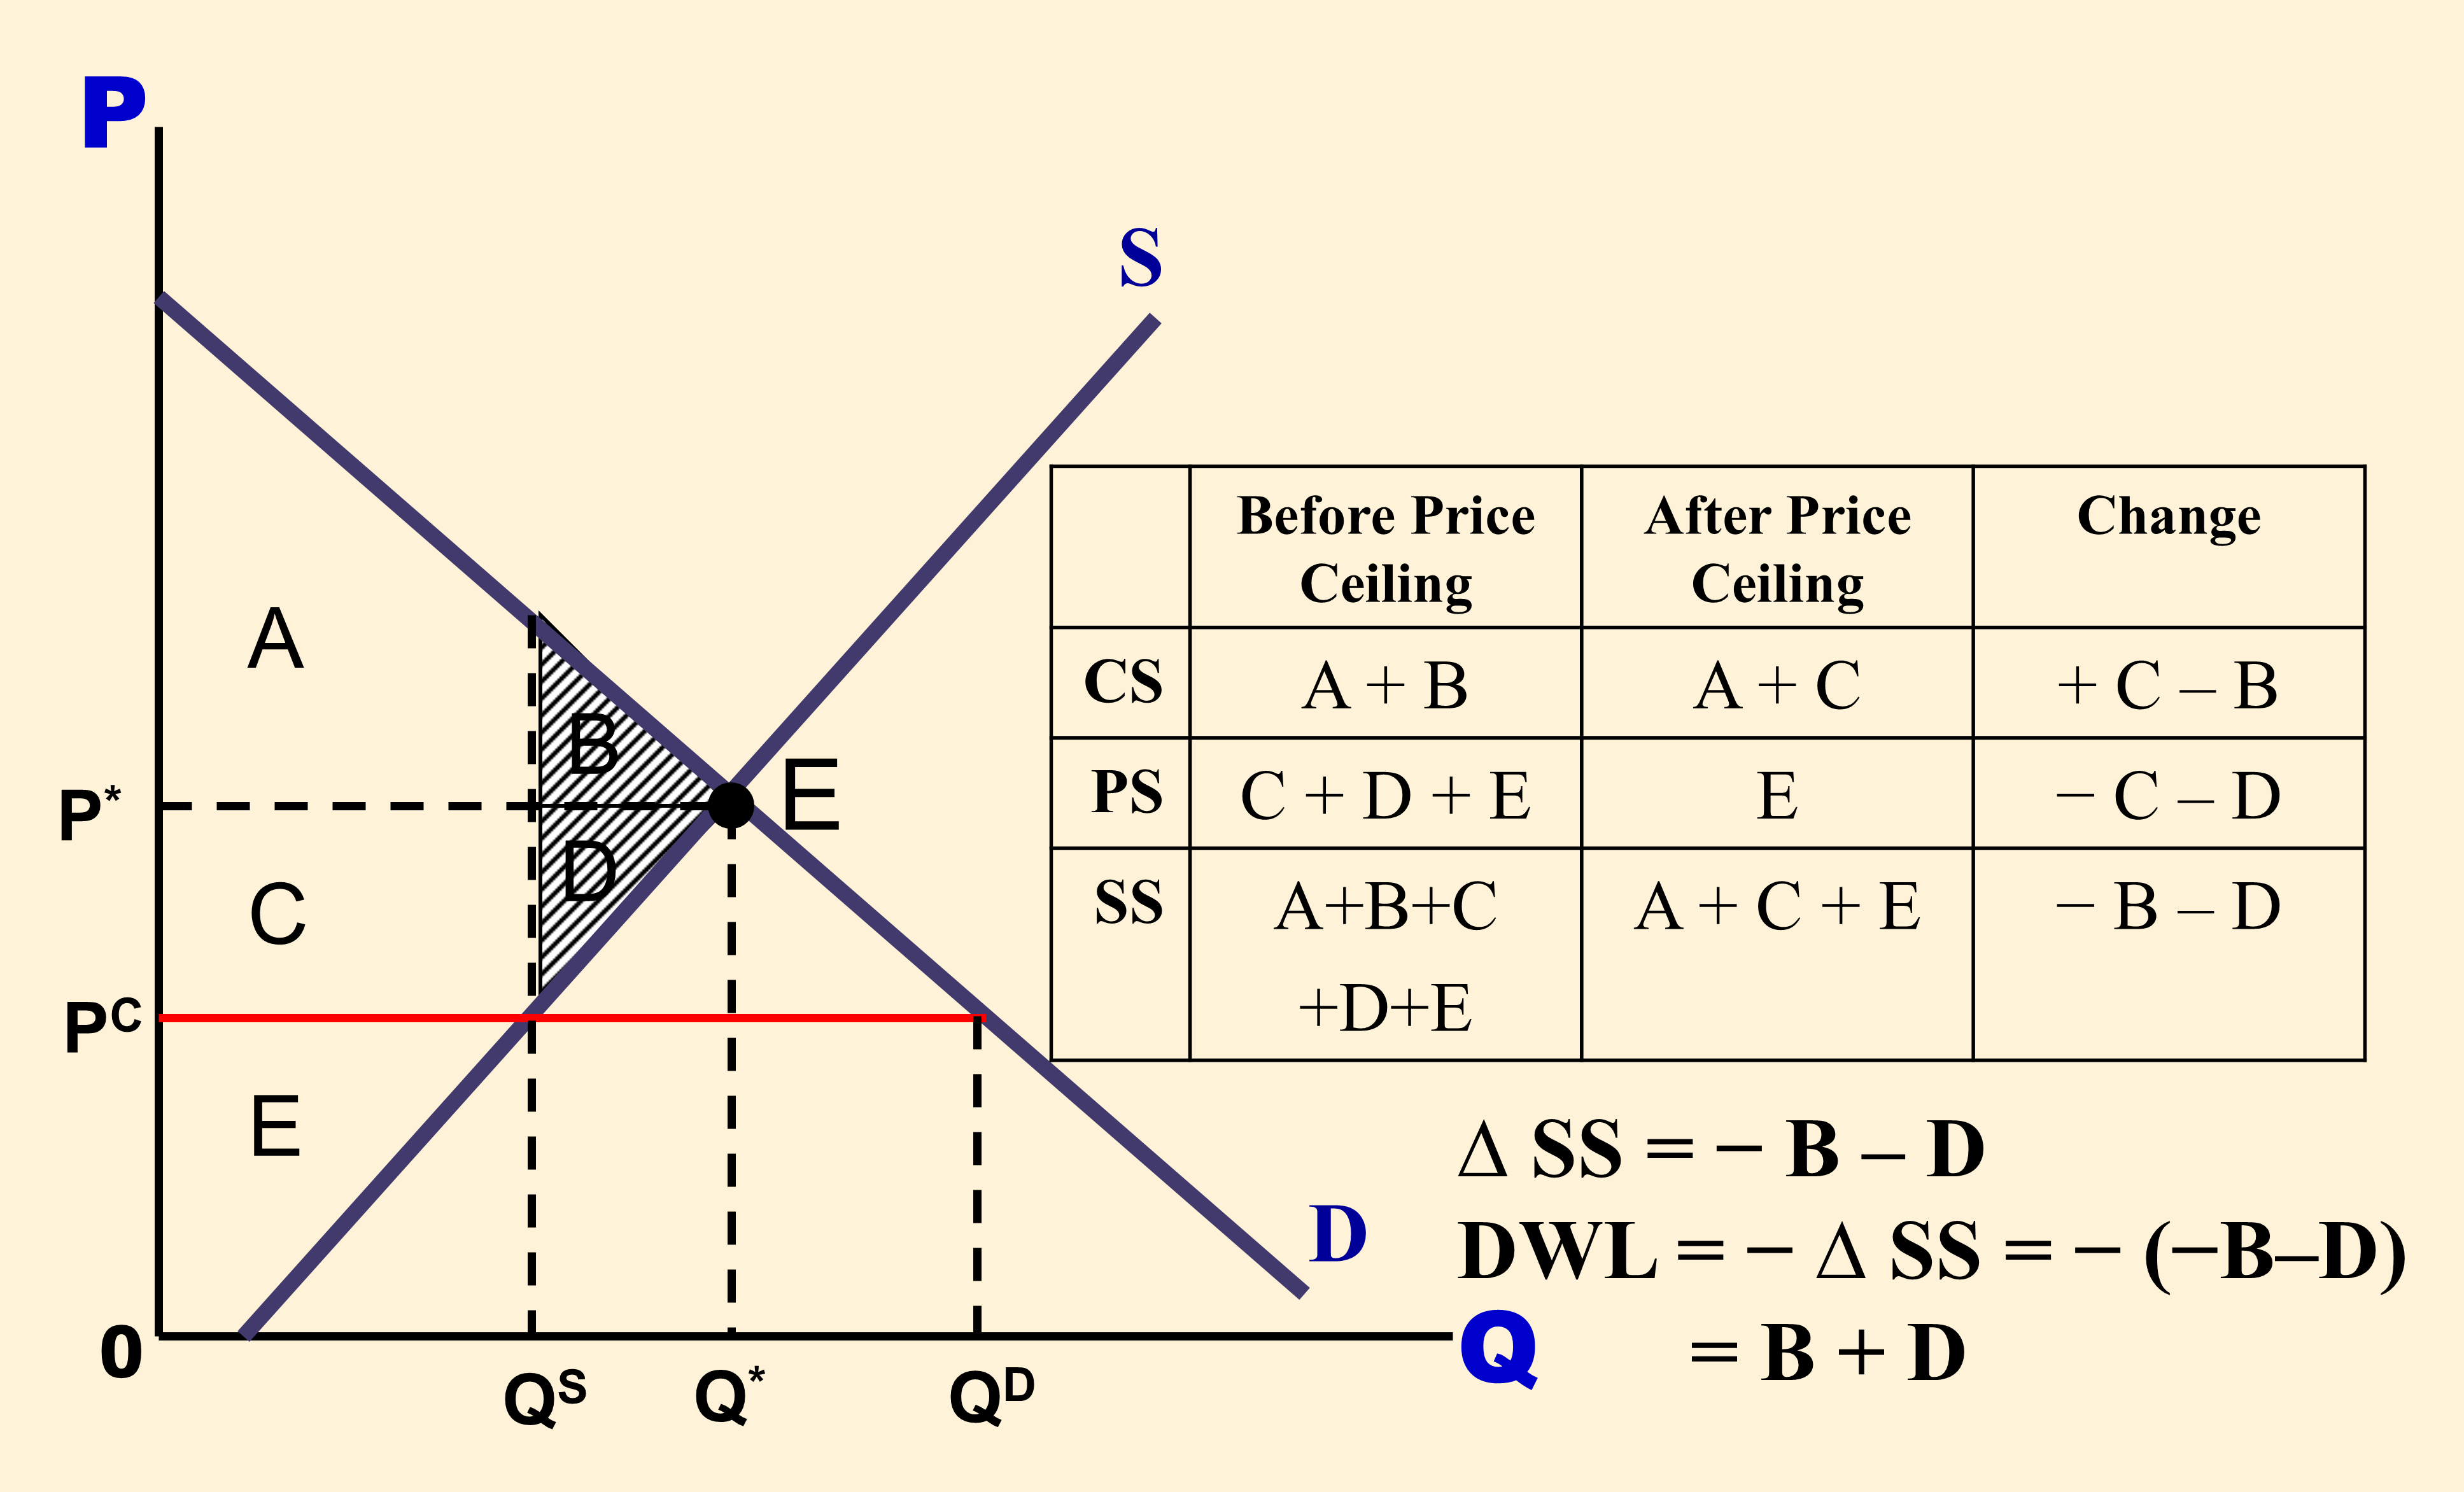
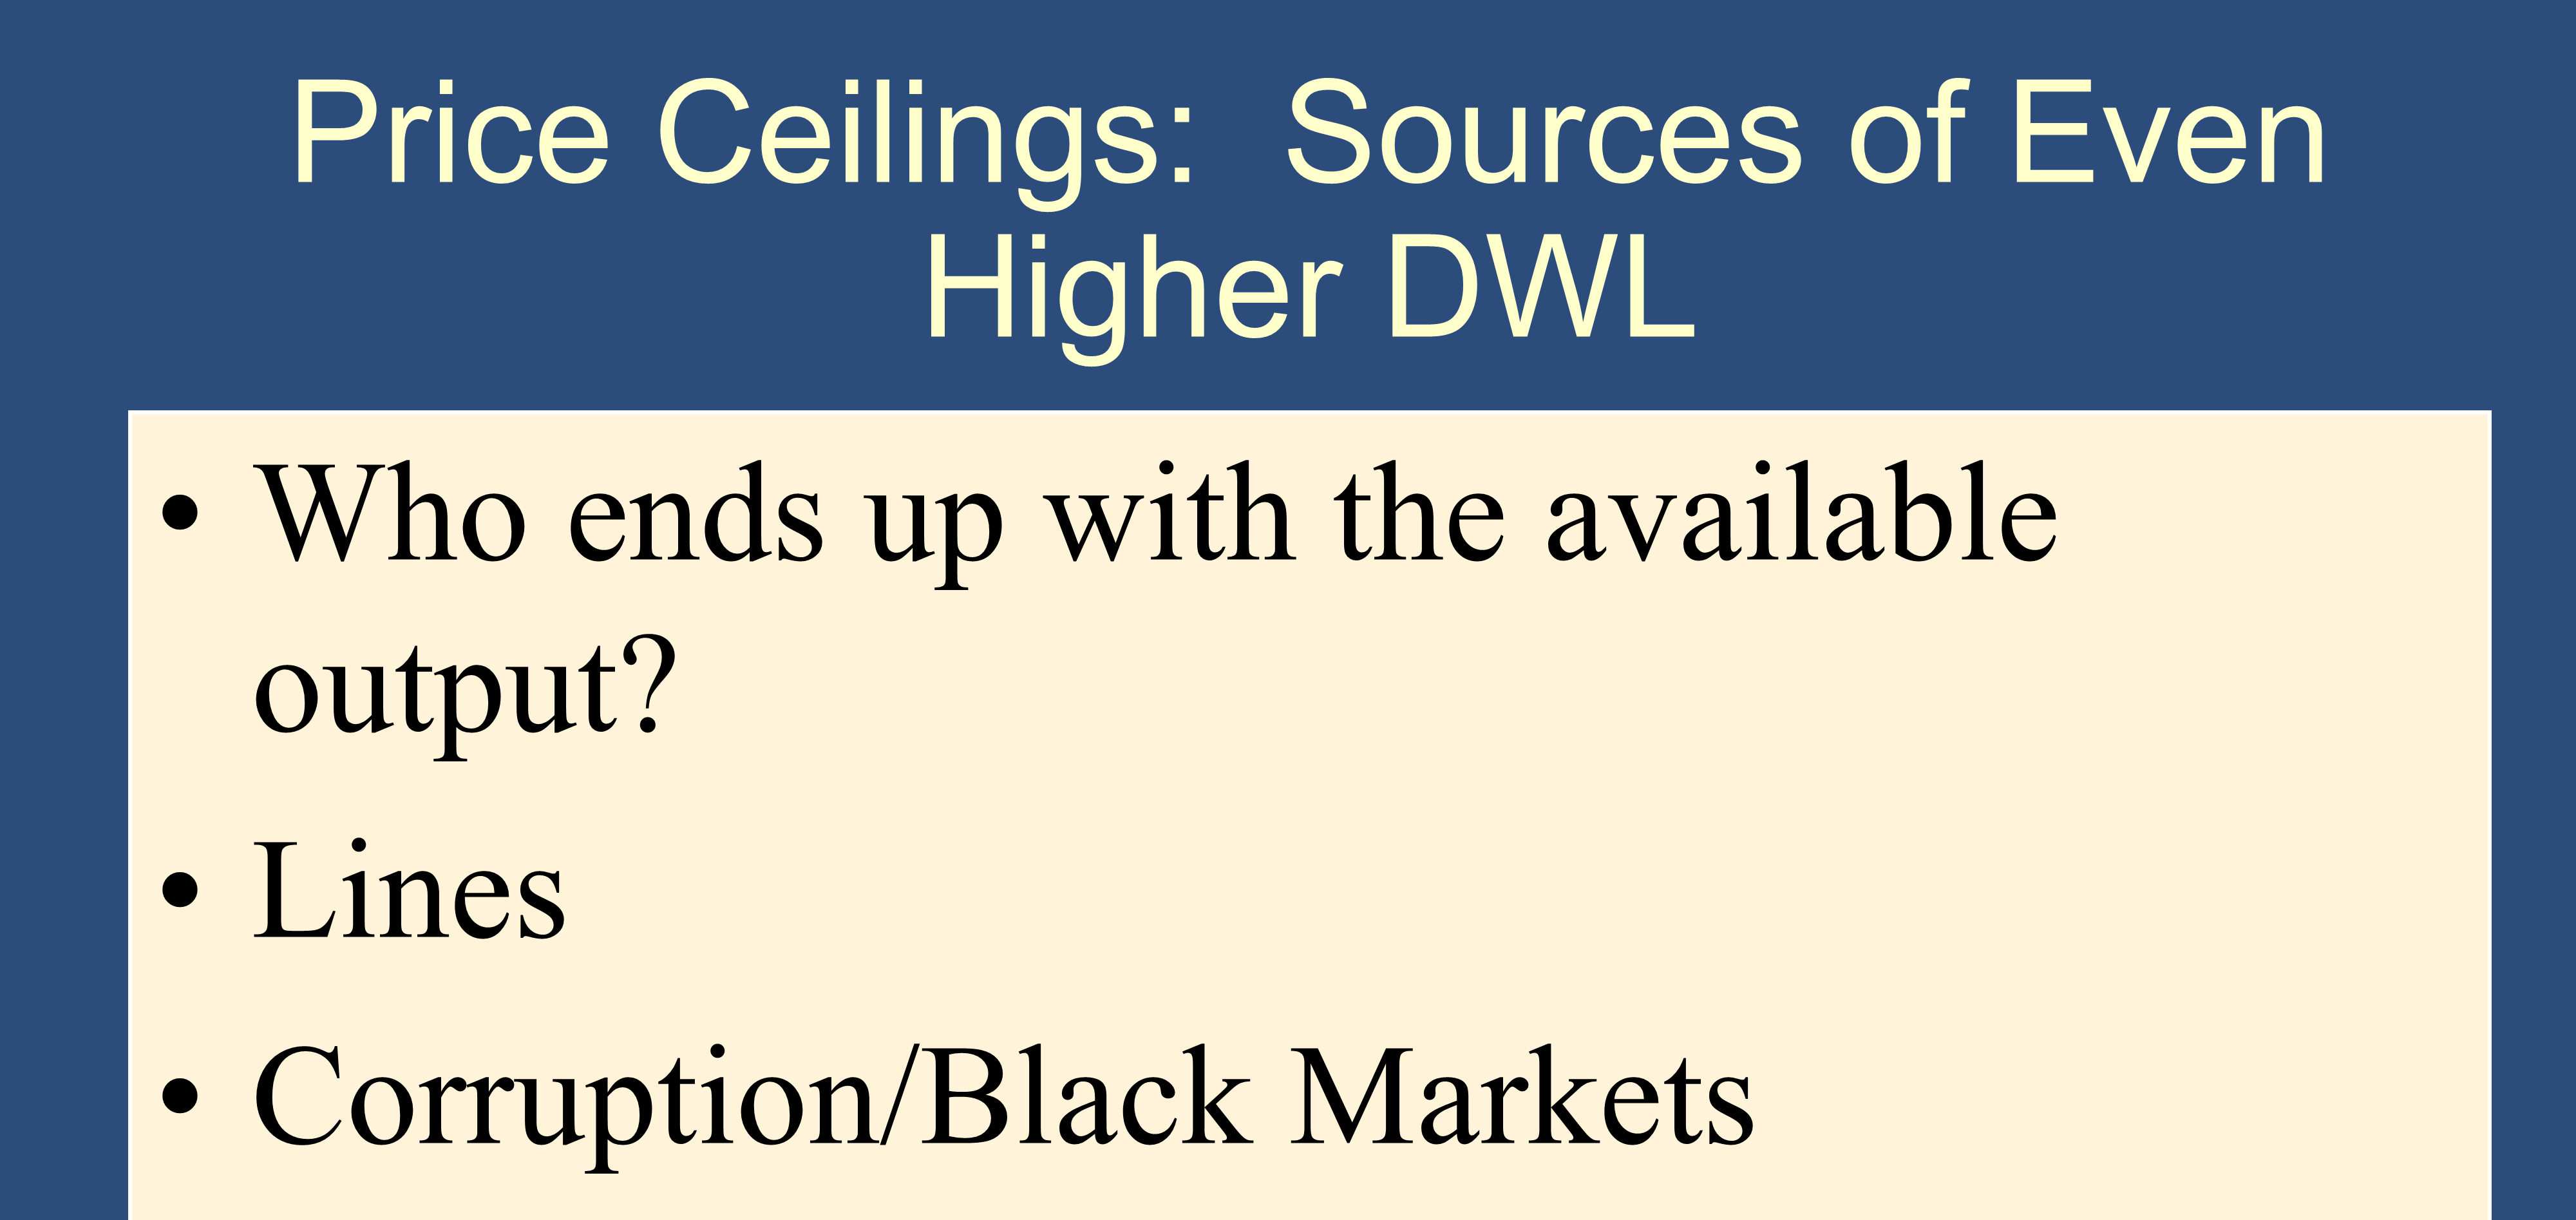
Price Ceilings: Sources of Even Higher DWL
- Who ends up with the available output? (With a price ceiling, there is a shortage, so many people would like to buy at the low PC price. Perhaps some of the people with lower Willingness To Pay get the limited output.)
- Lines
- Corruption/Black Markets
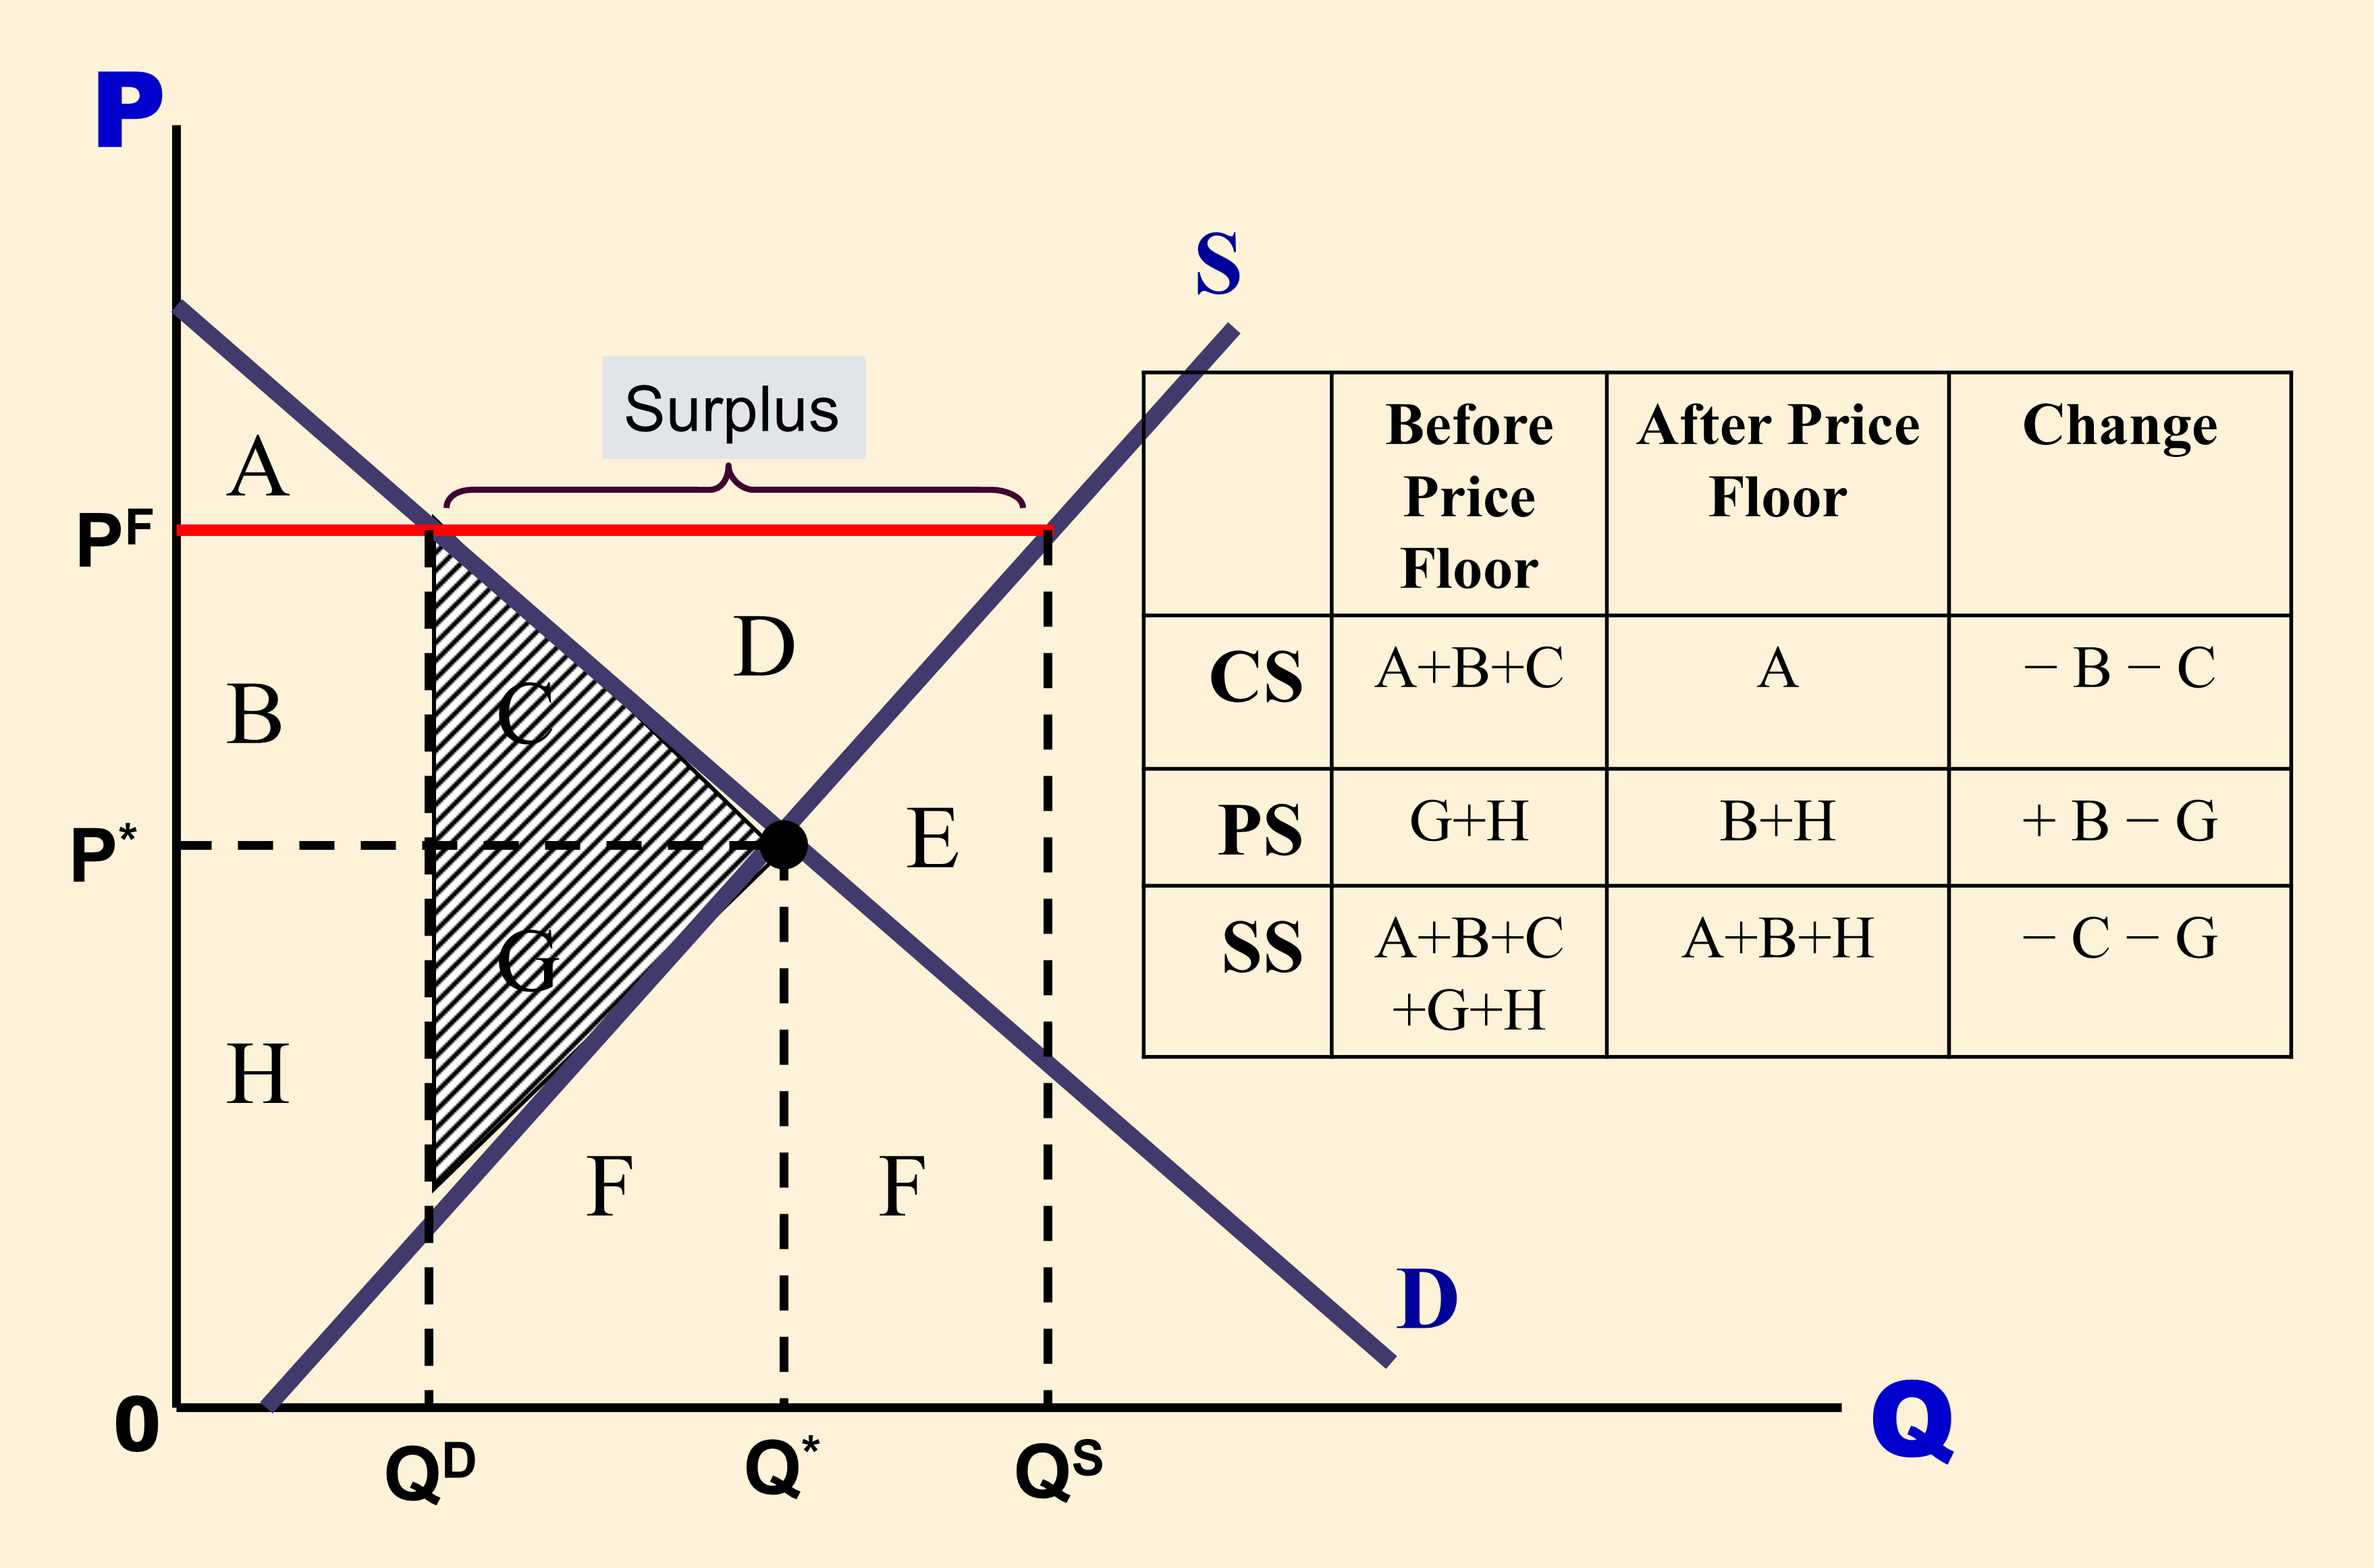
Welfare Analysis of a Price Floor: Govt. Does Not Buy Surplus
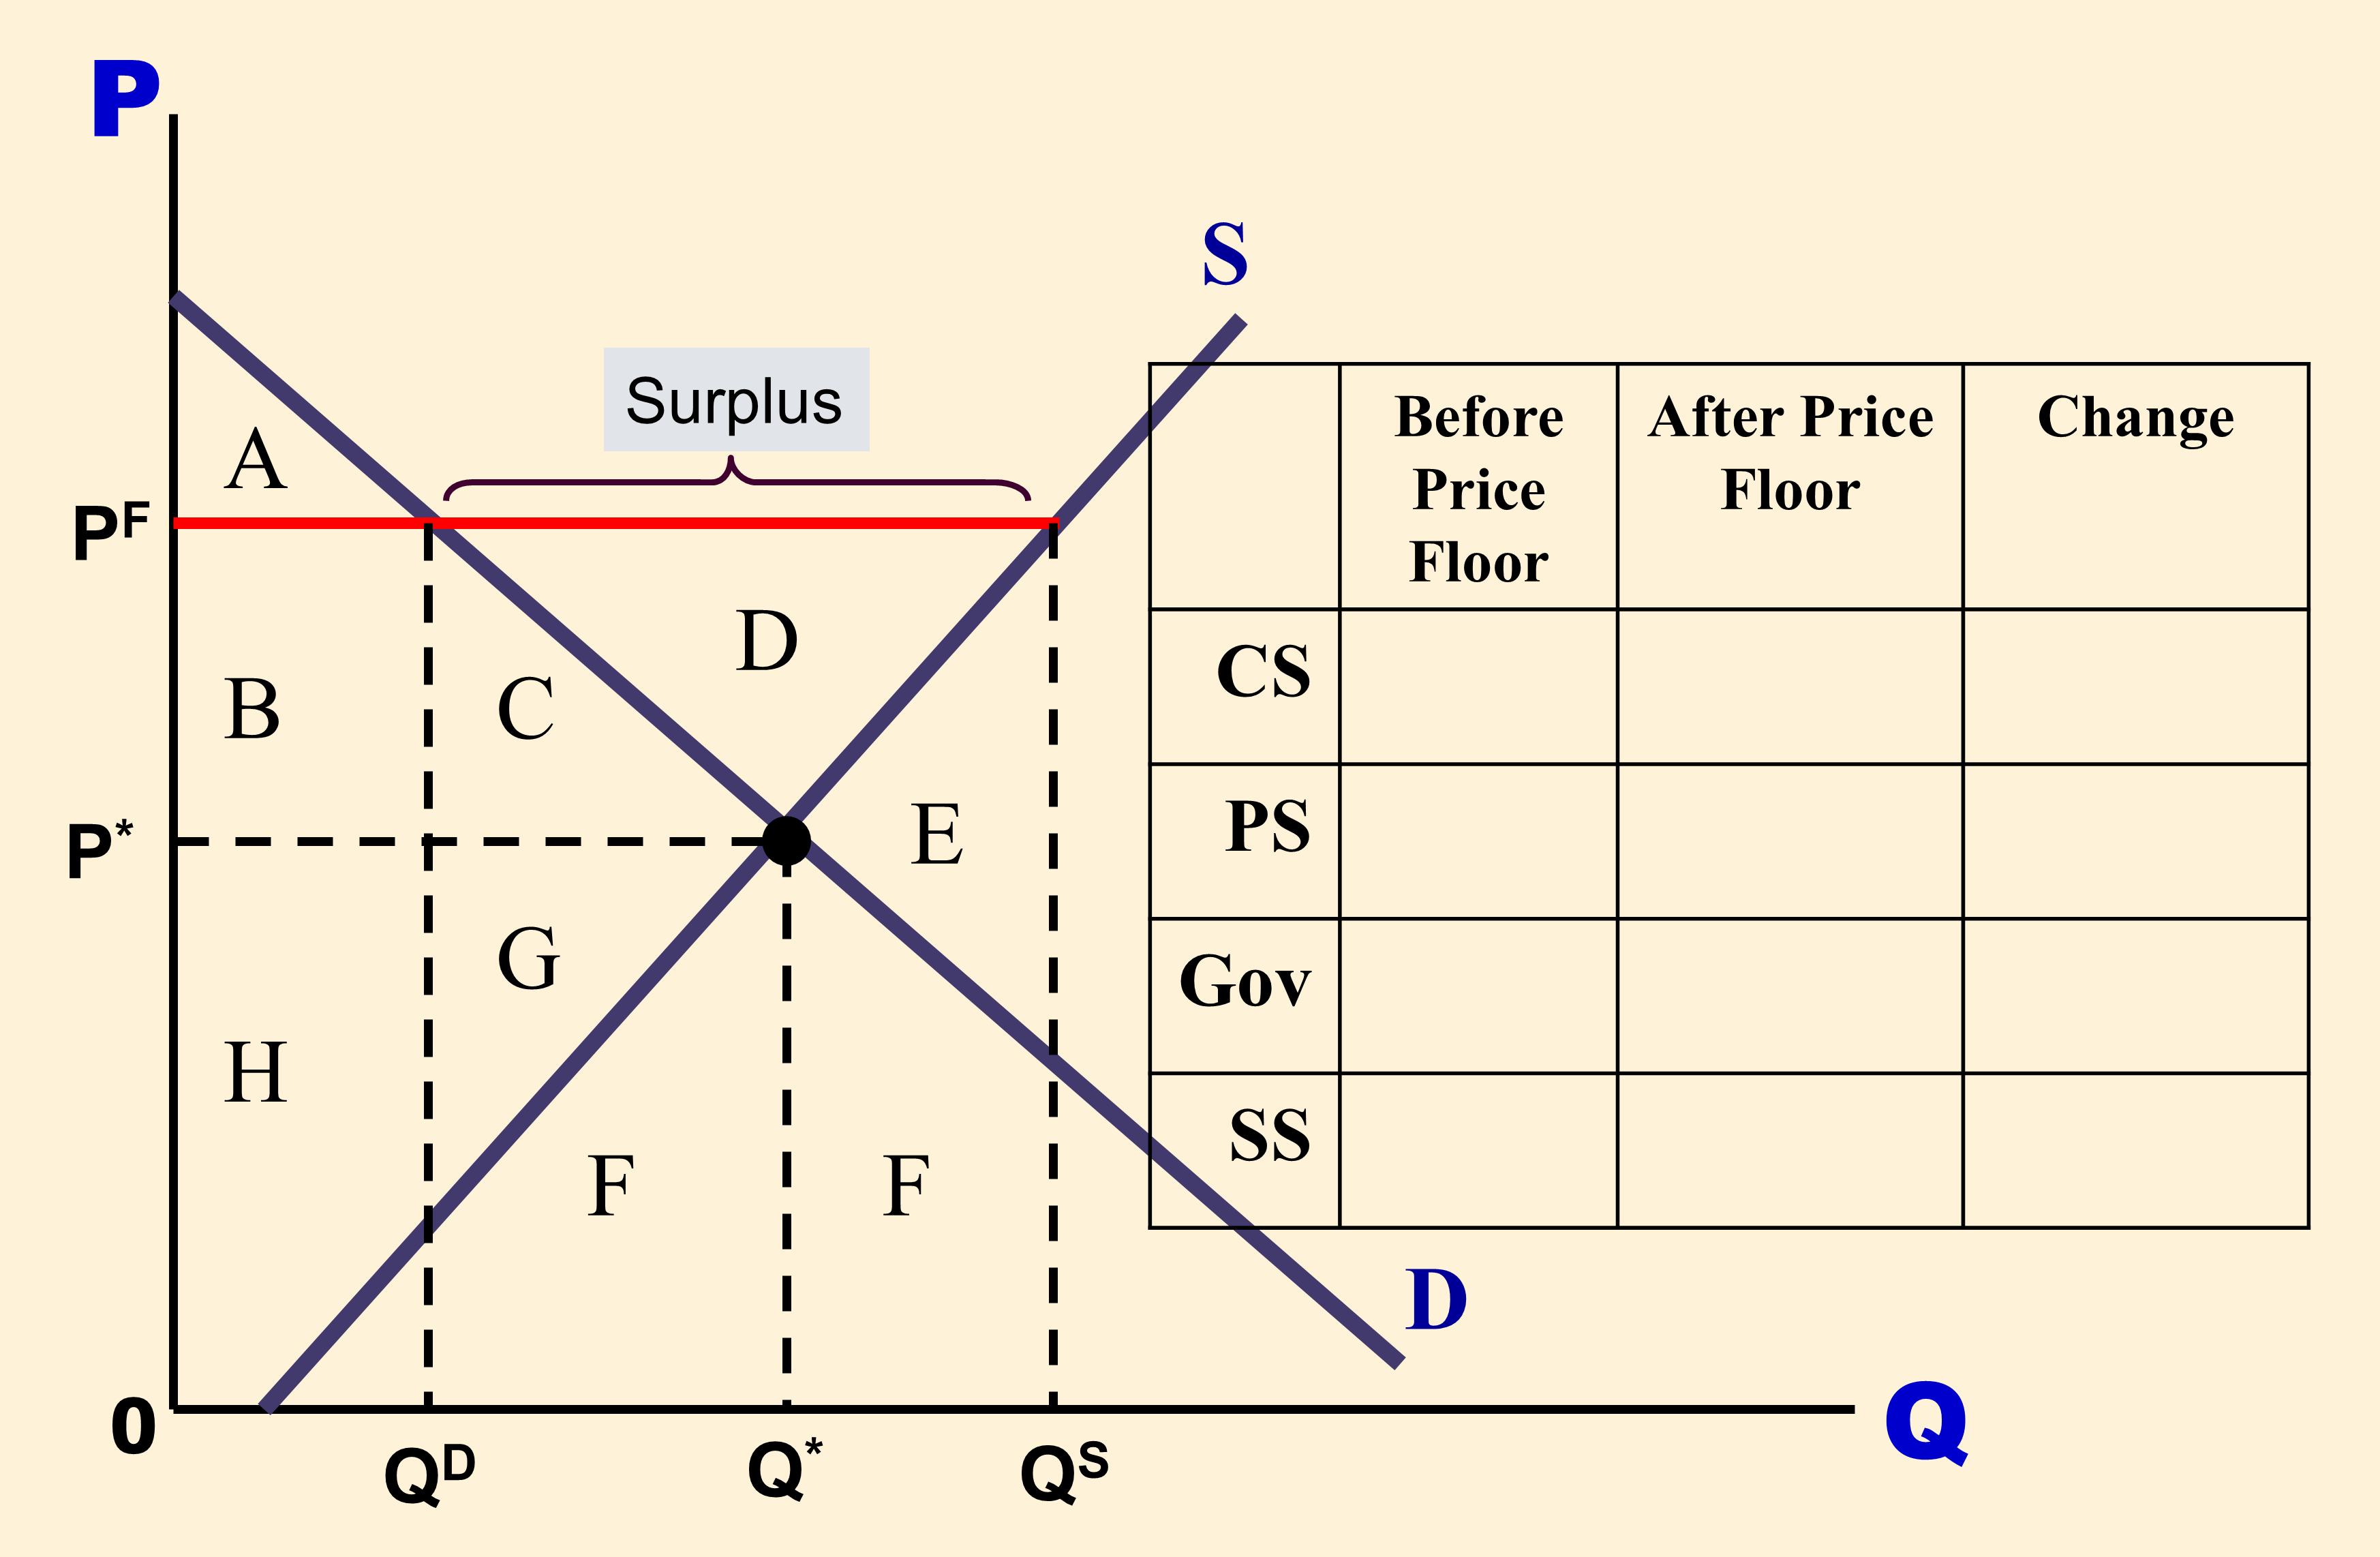
Welfare Analysis of a Price Floor: Govt. Does Buys the Surplus
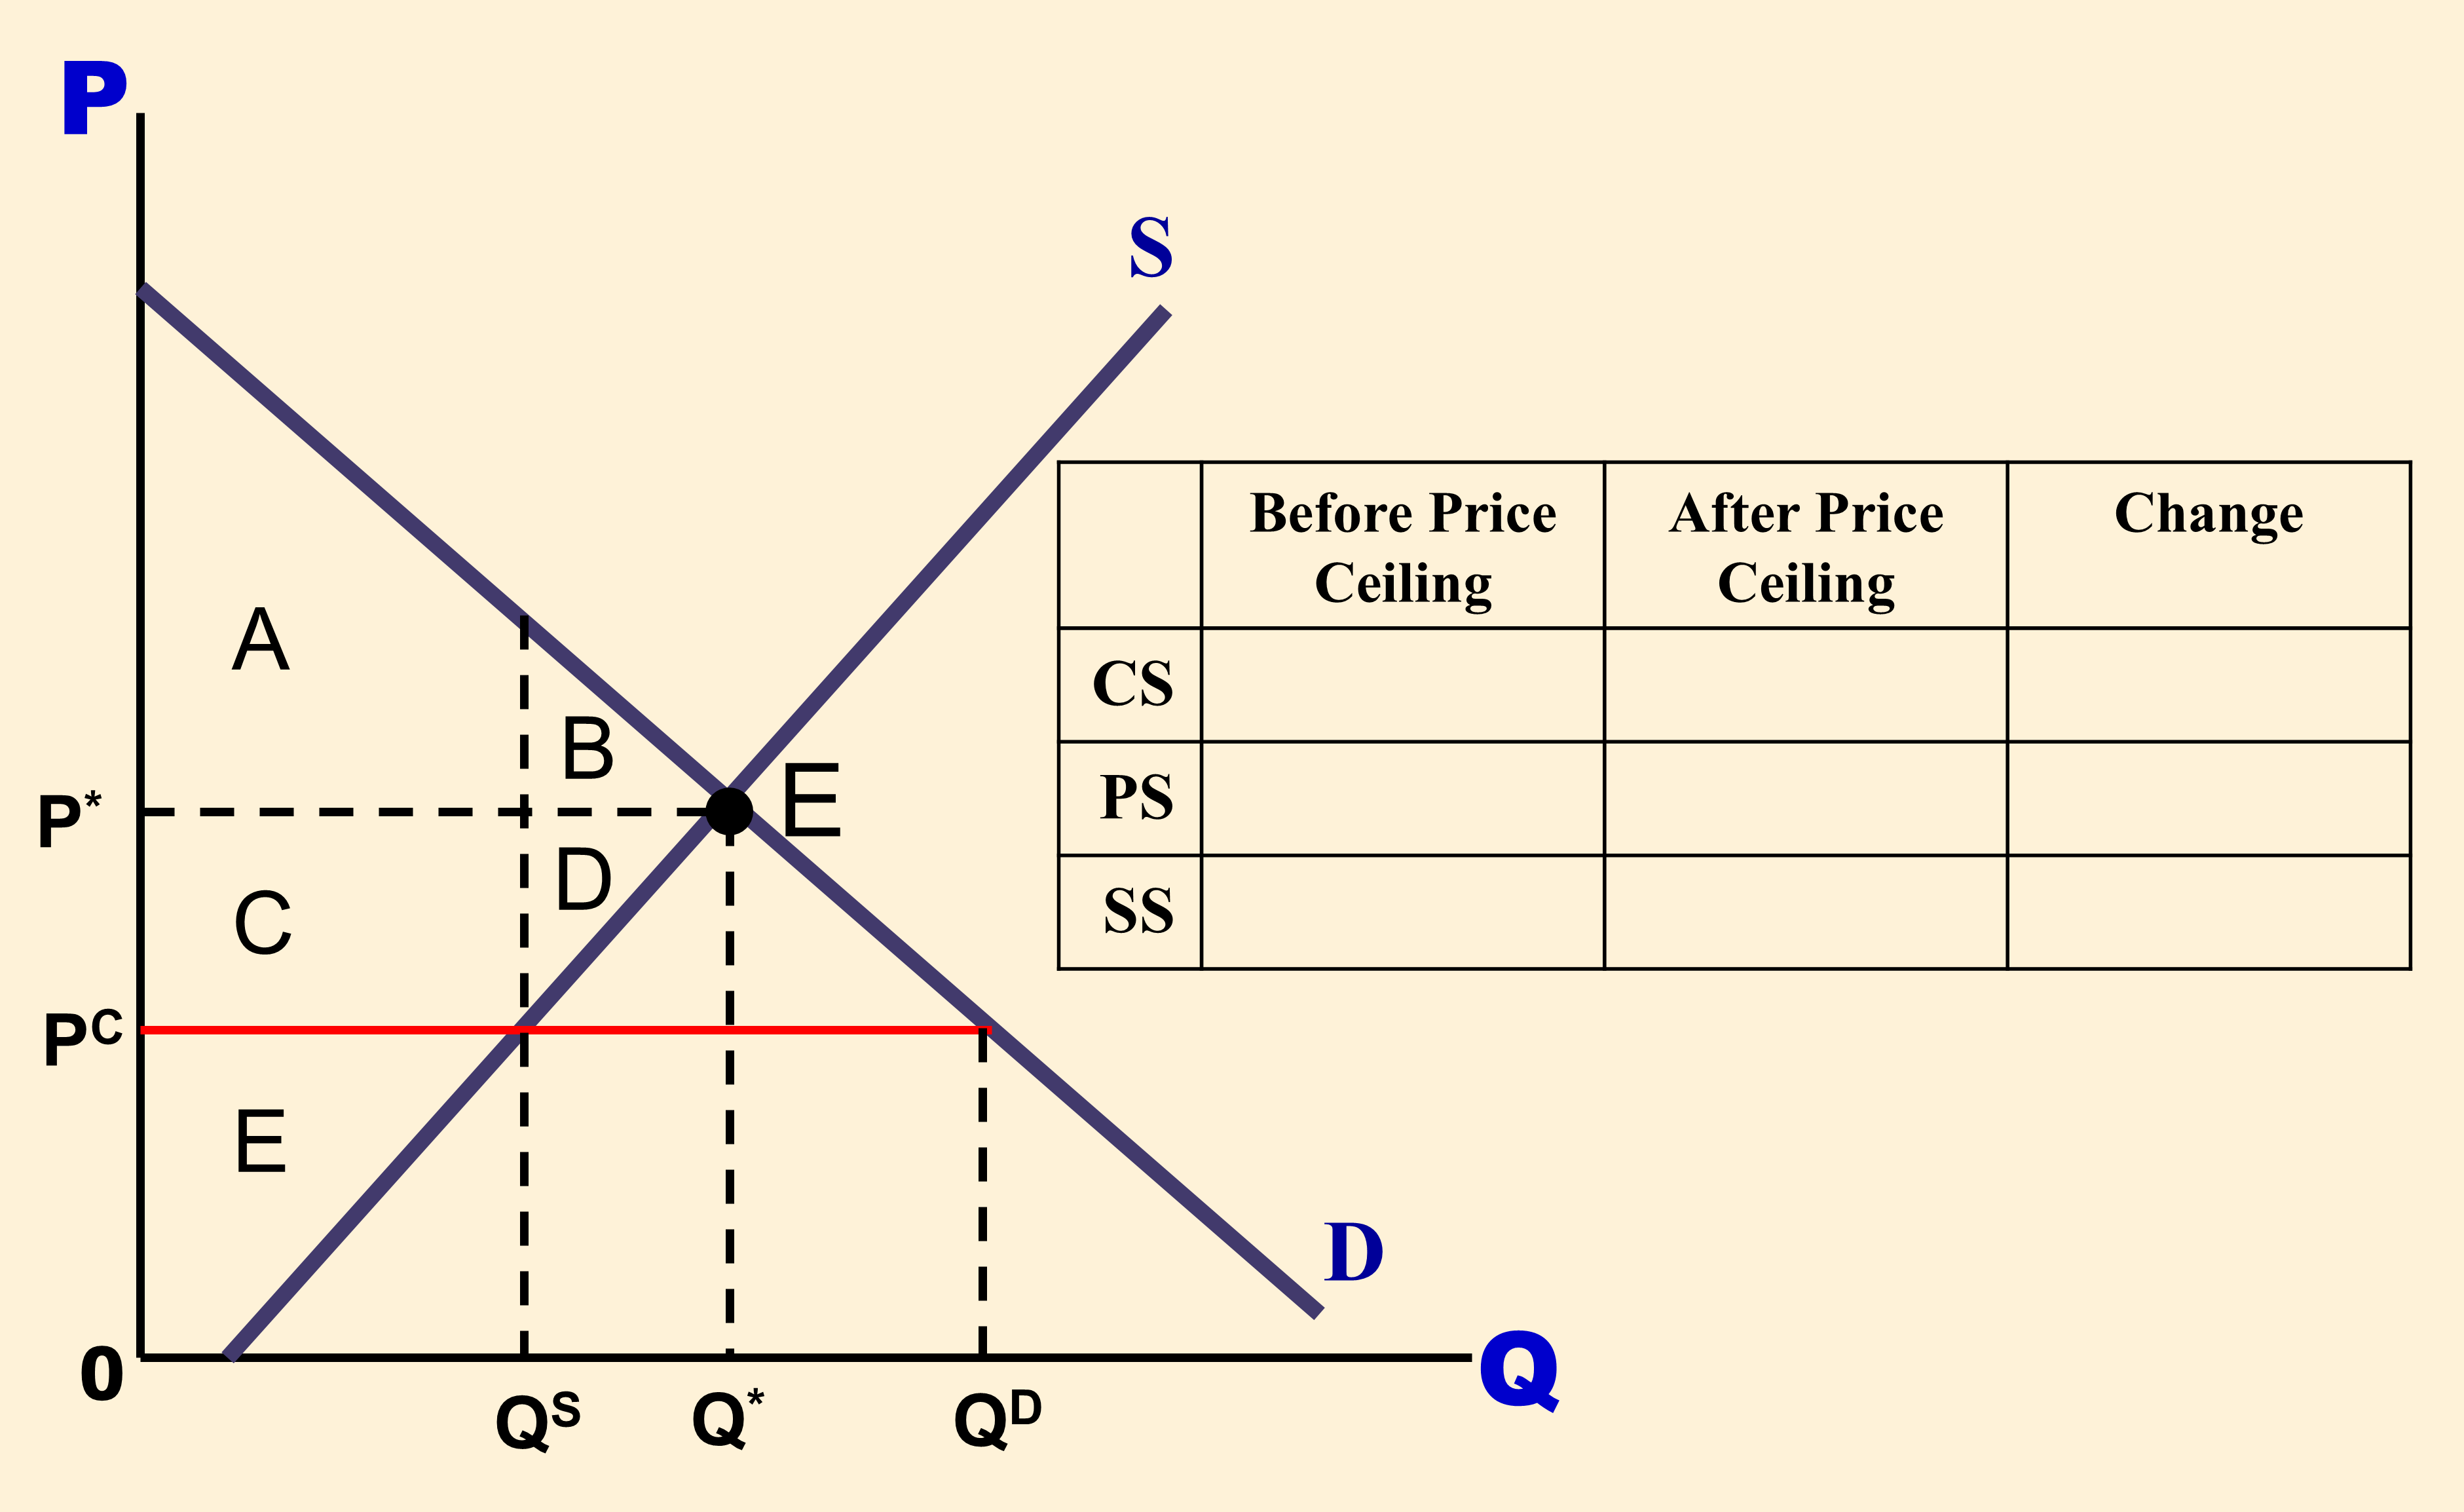
Study suggestion: can you print out blank versions of the above three slides and fill them in yourself?
Welfare Analysis of Price Ceiling
Welfare Analysis of a Price Floor: Govt. Does Not Buy Surplus
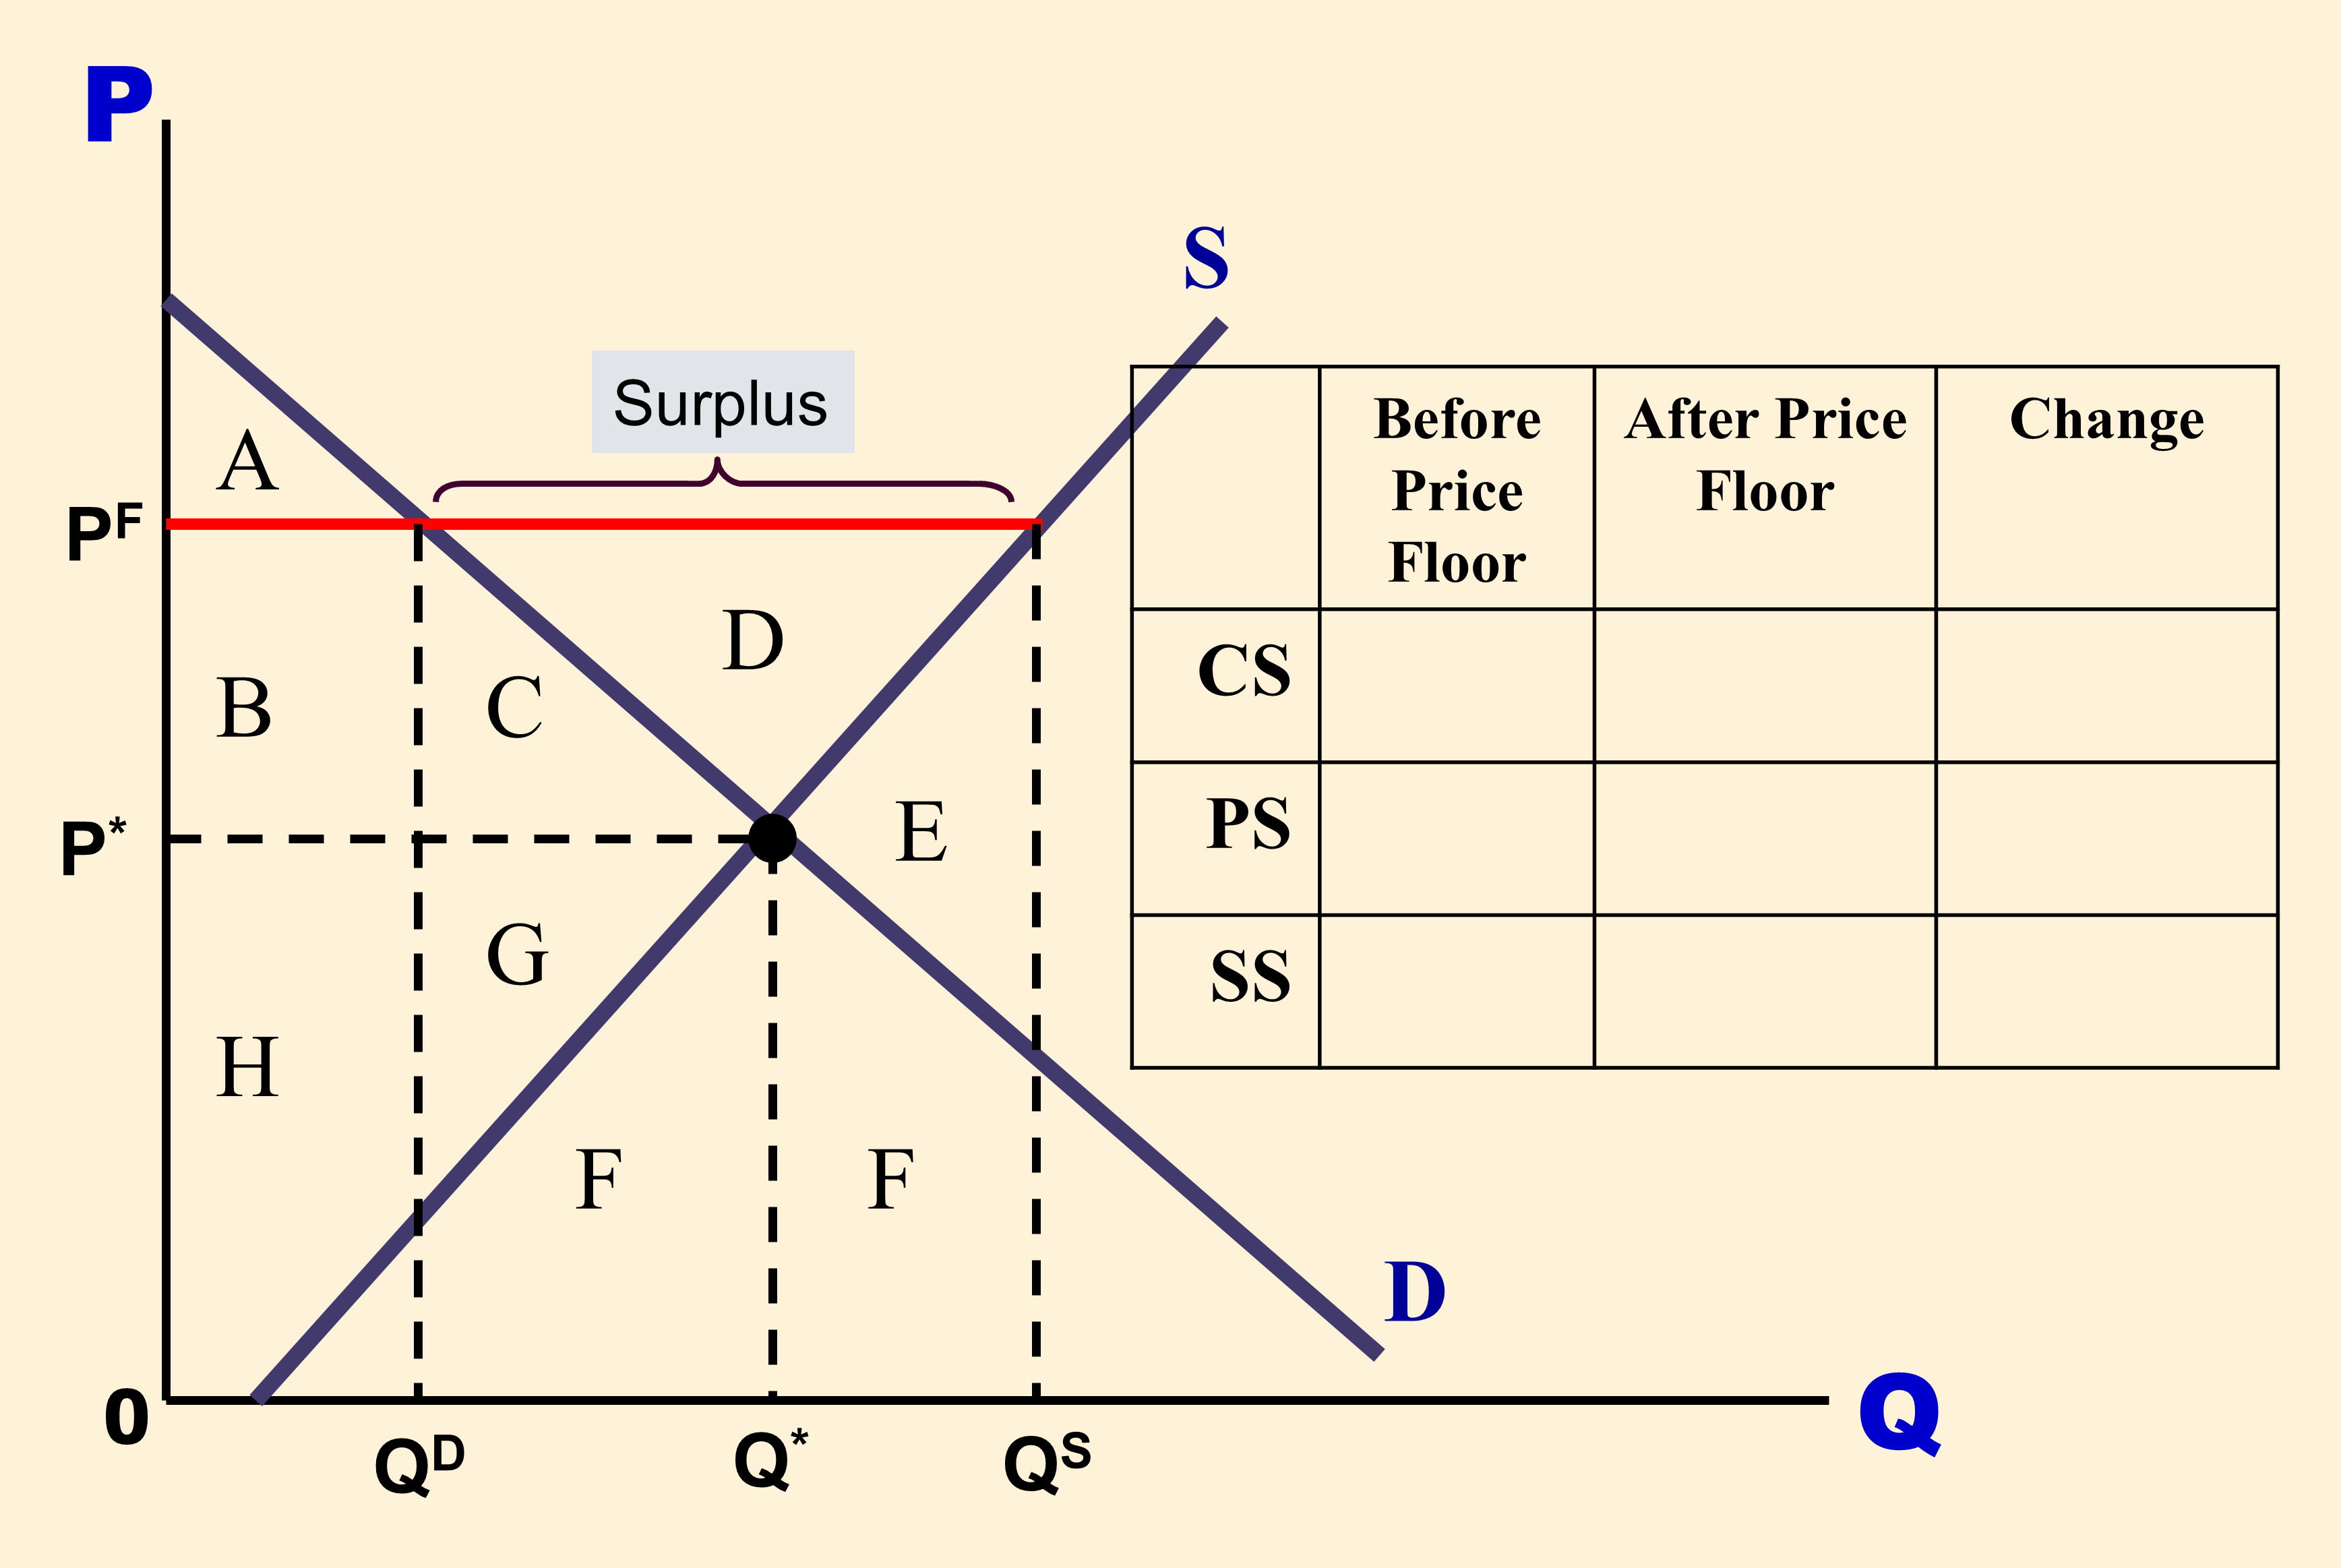
Welfare Analysis of a Price Floor: Govt. Does Buys the Surplus
✏️ Suppose that the government removes a rent control price ceiling at PC. Assume that when there is a shortage, the consumers with the highest willingness to pay get the good. What letters represent the change in surplus to Consumers? To Producers? To society?
Welfare Analysis of Price Ceiling
✔ Click here to view answer
- Consumers gain: B (type L consumers are happier because there are more apartments available.
- Consumers Lose: C (type H consumers have to pay a higher price)
- Producers gain: C (efficient producers receive a higher, non-rent-controlled price) + D (Inefficient producers can now enter the market)
- Producers lose: Nothing!
- Society gains: B + D
- Society loses: 0
✏️ What did I mean by, “Assume that when there is a shortage, the consumers with the highest willingness to pay get the good. ”
✔ Click here to view answer
Using the stair step diagram, we are assuming that the consumers with the highest willingness to pay (WTP) get the good. However, that might not be true, so price ceilings can cause even more damage to social surplus, as shown in the following slide:
Price Ceilings: Sources of Even Higher DWL
Feedback? Email munger.e1010@gmail.com 📧. Be sure to mention the page you are responding to.