🔎 Returns to Scale vs. Economies of Scale vs. Economies of Scope
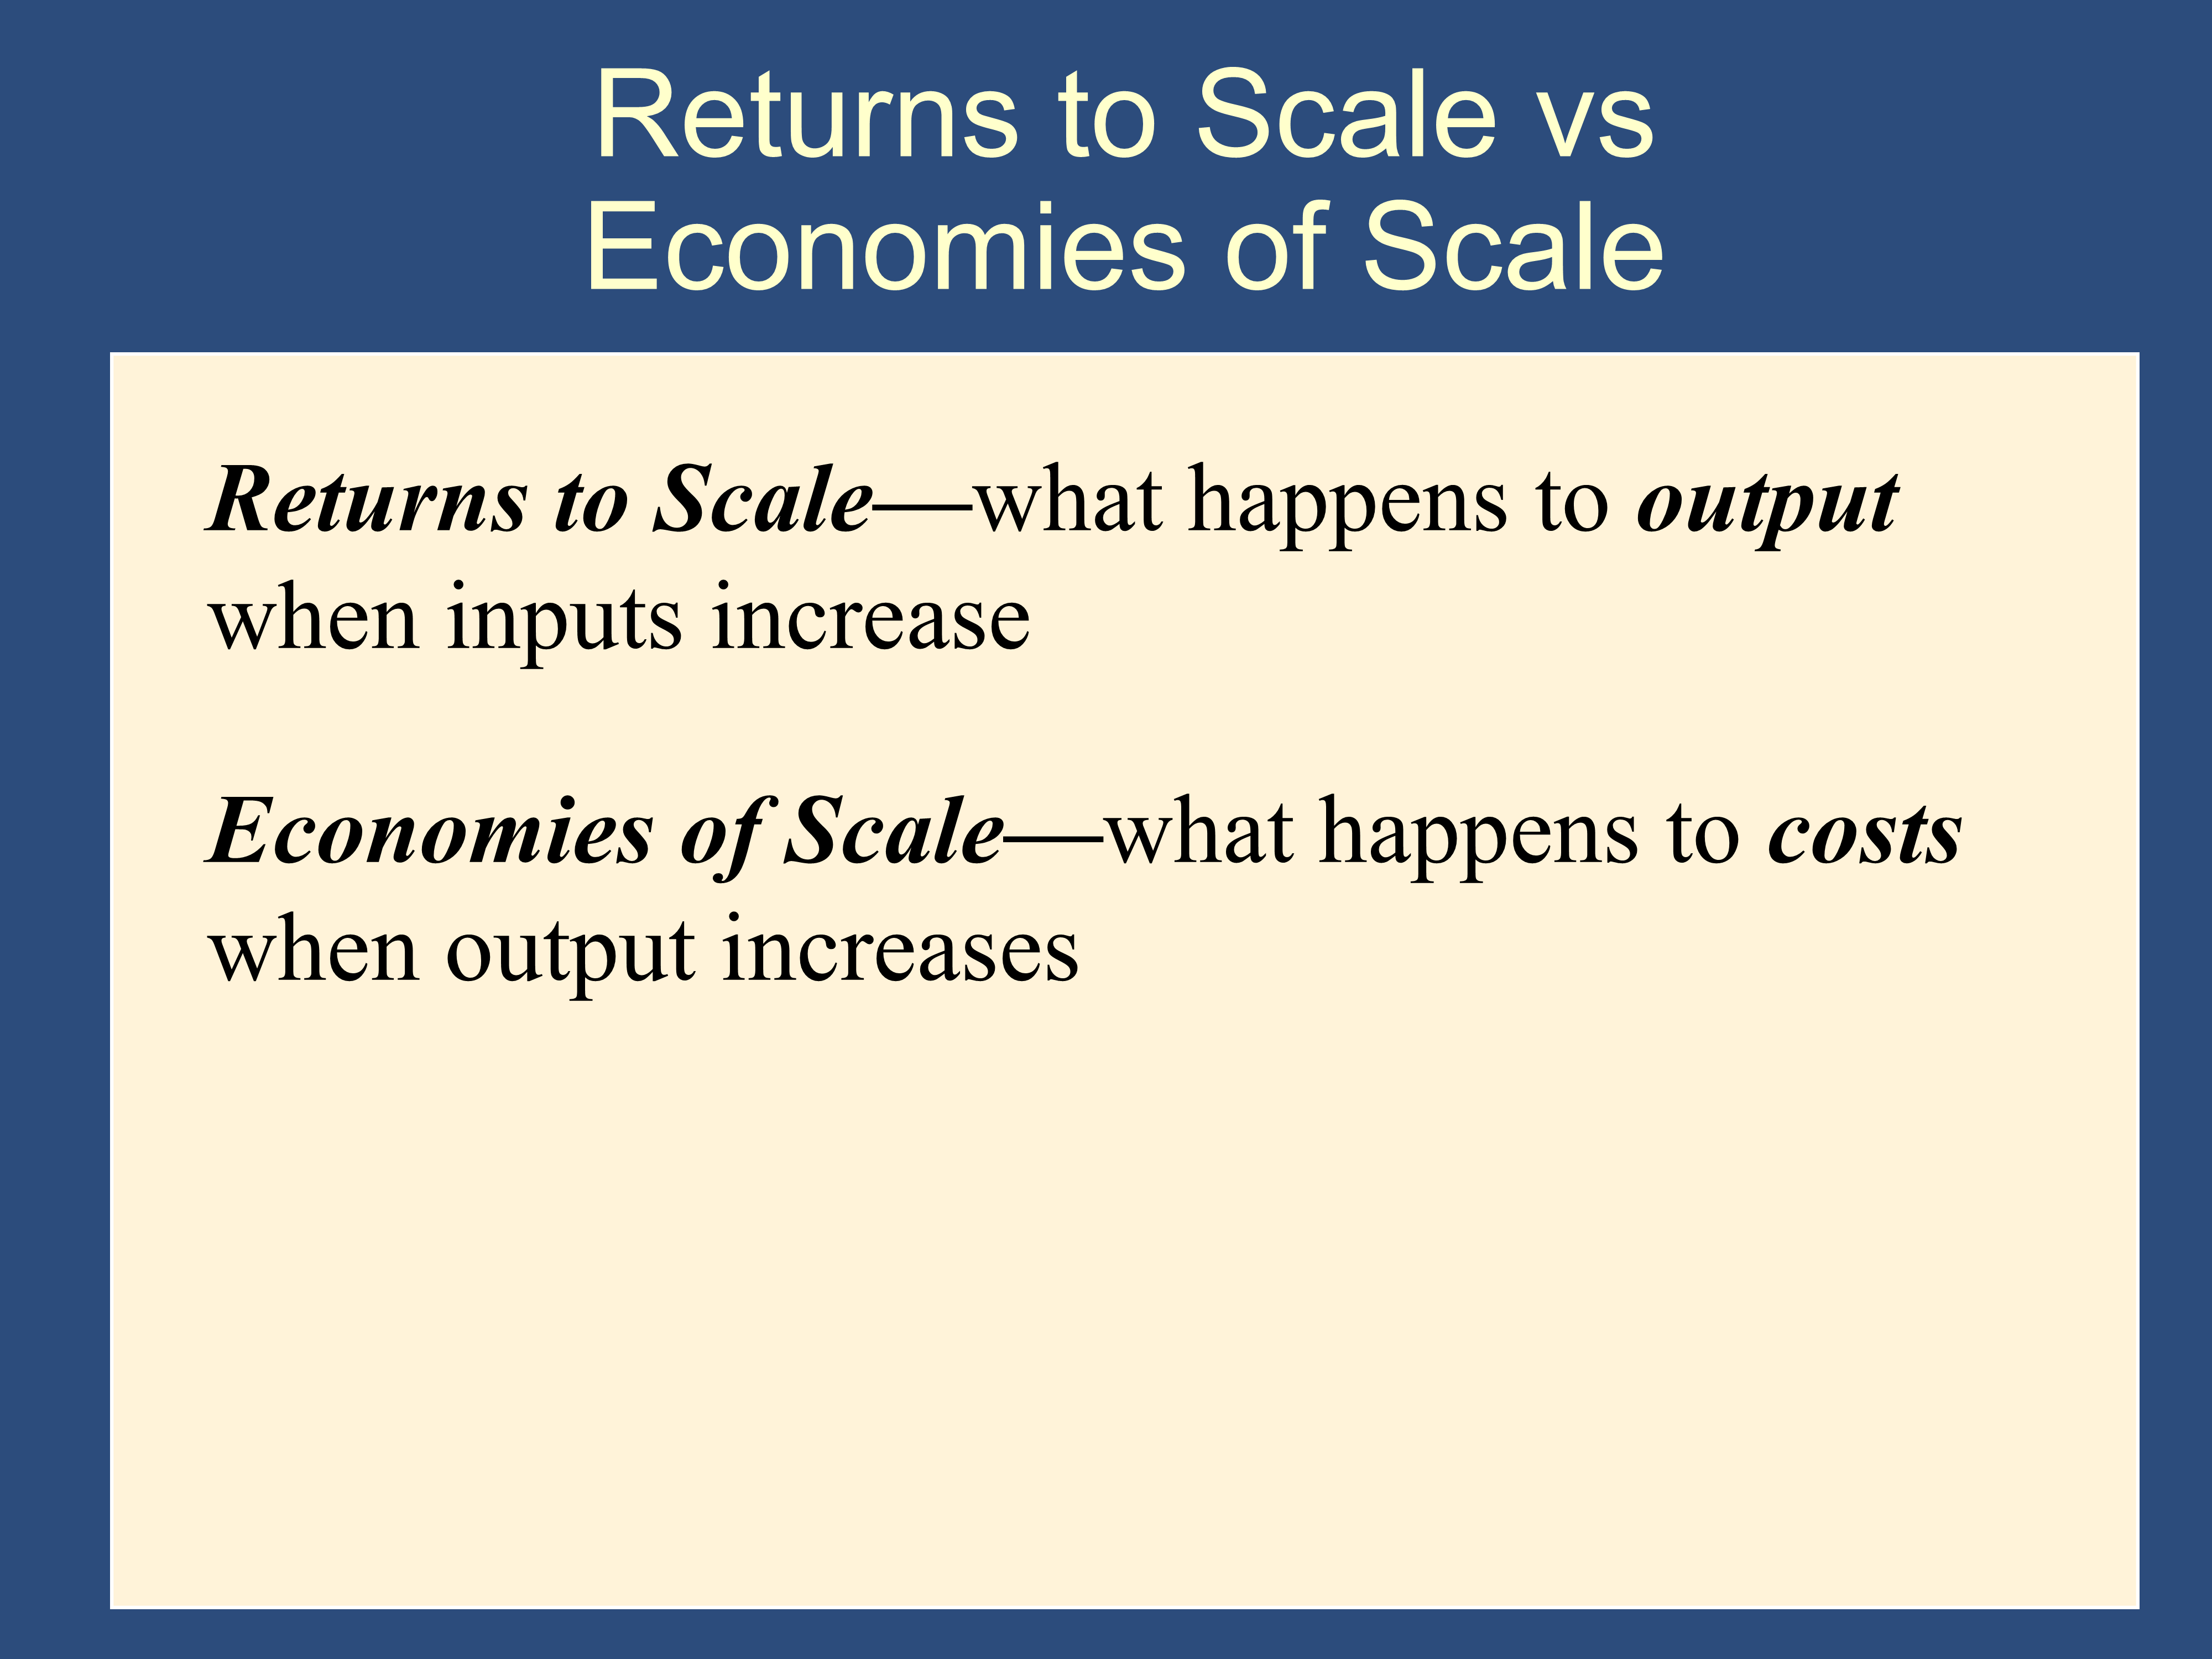
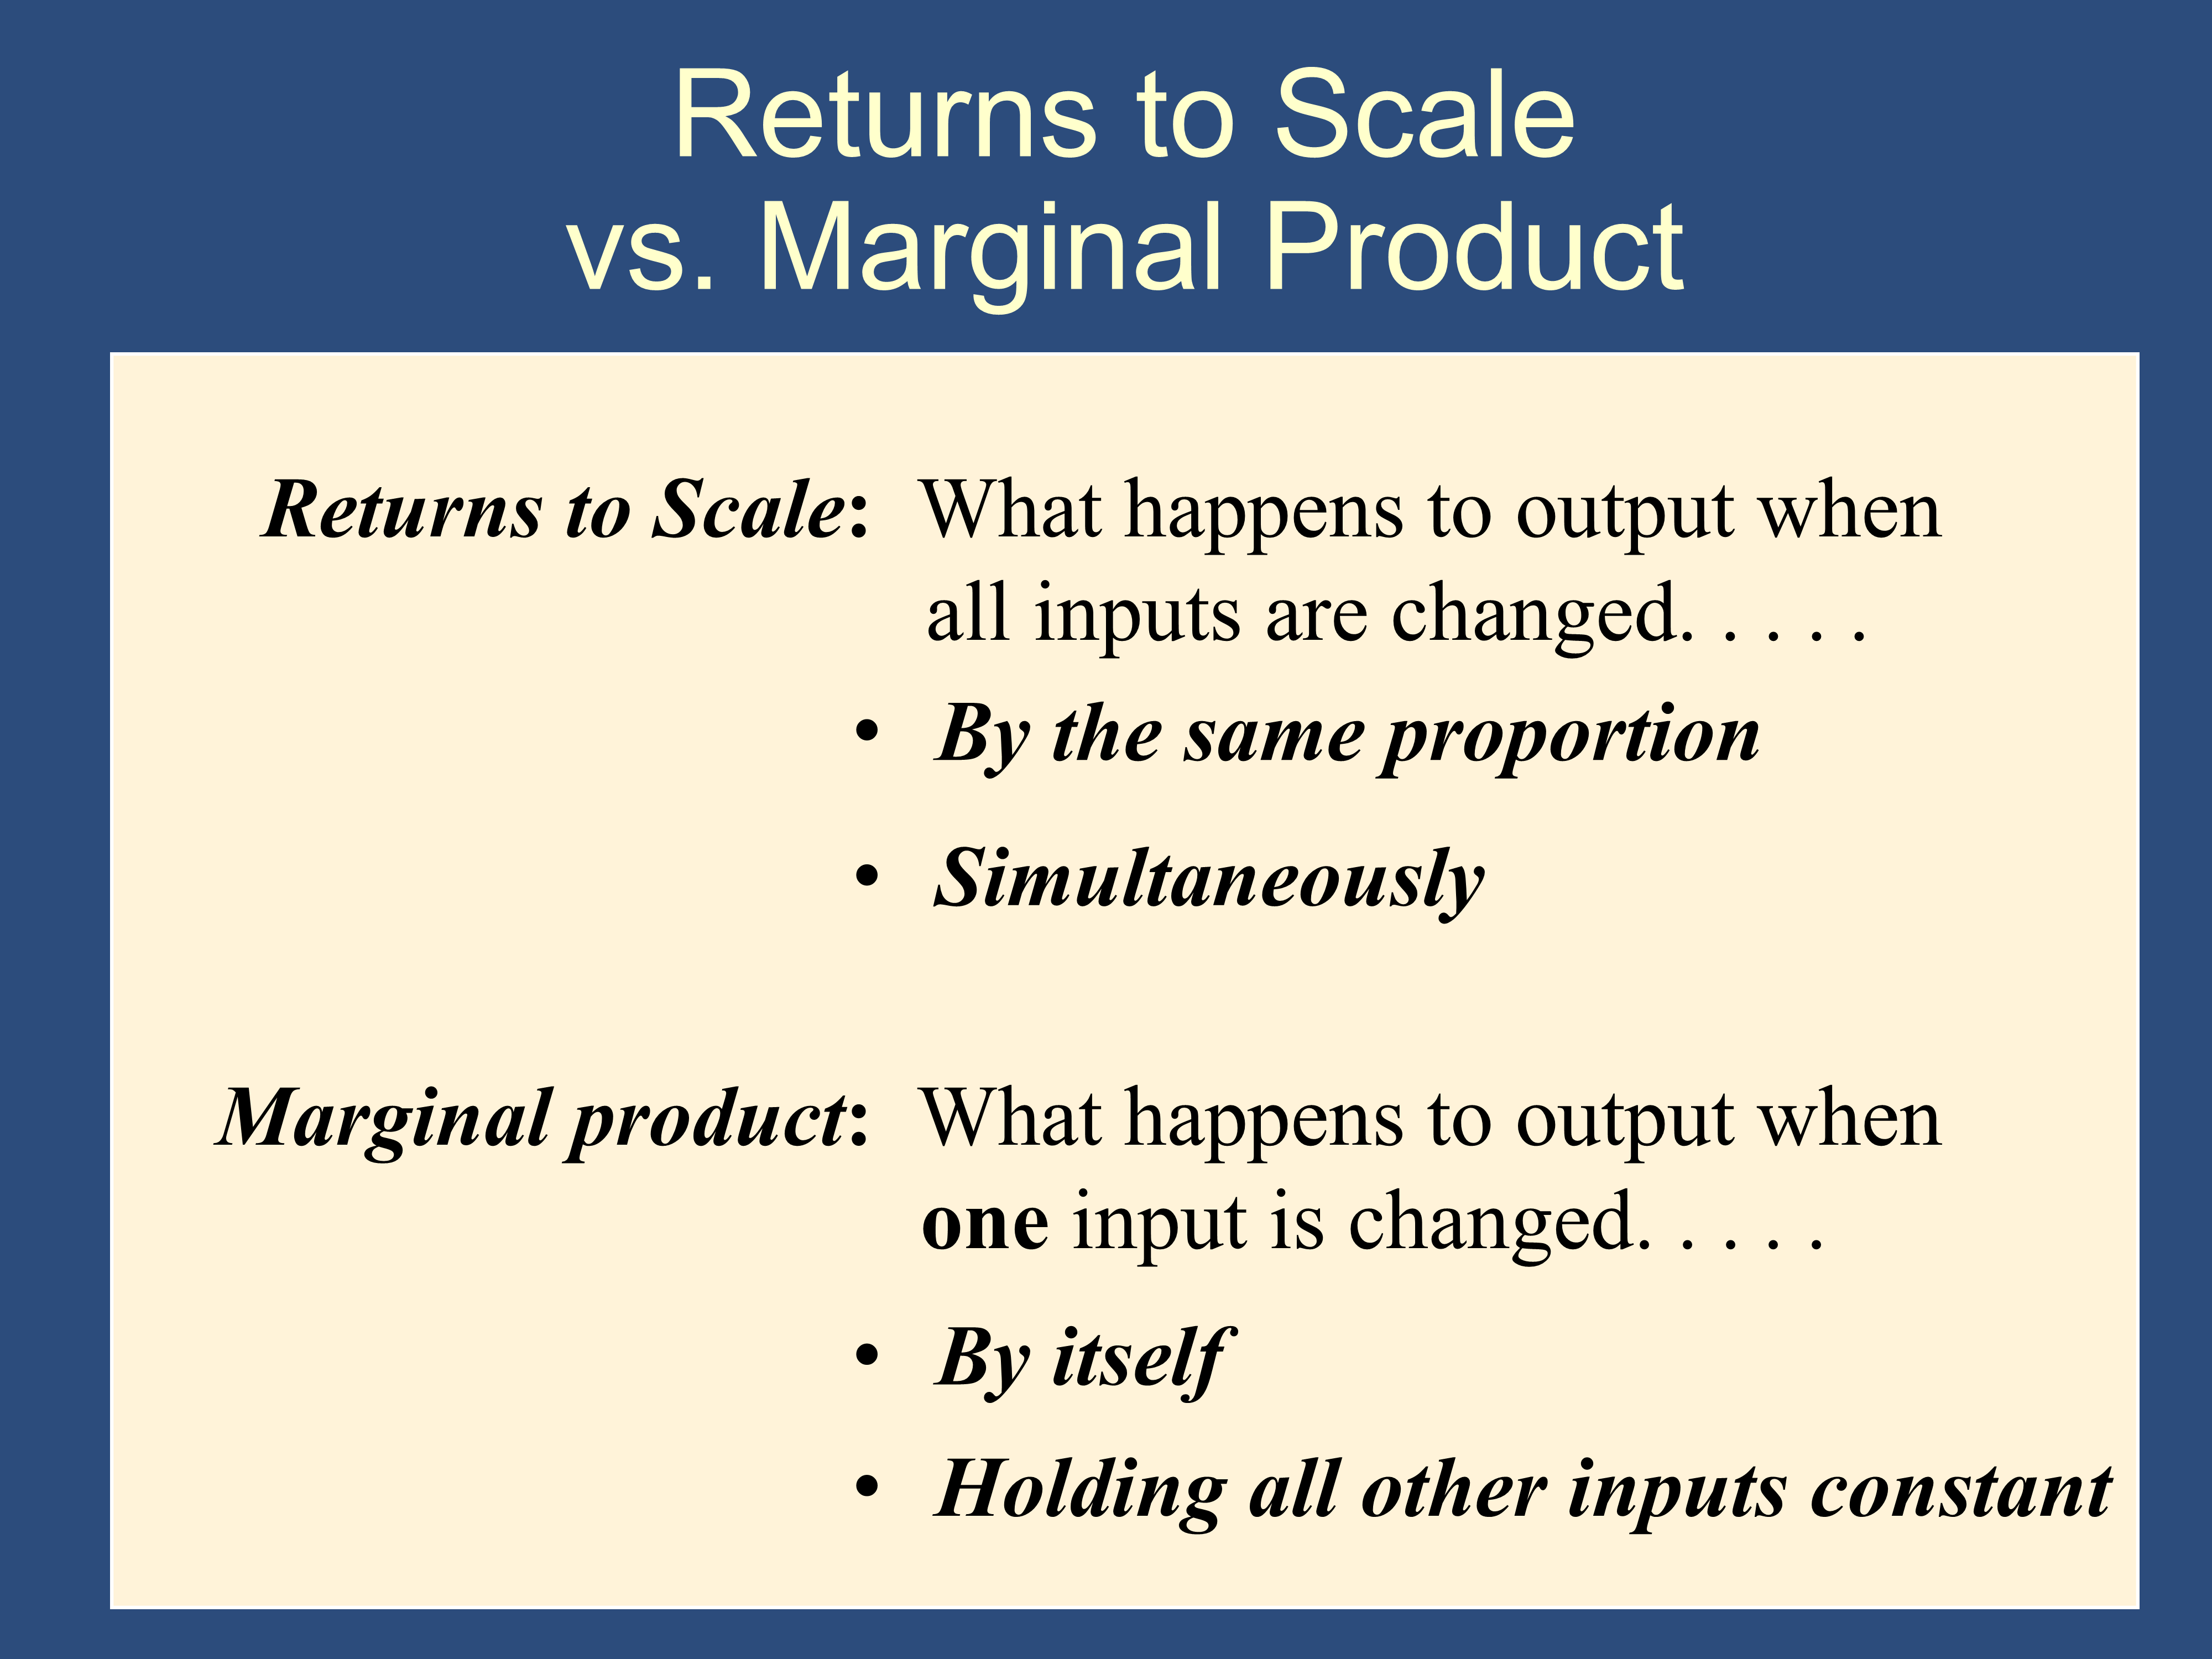
All of these concepts help us identify how “Bigger is Better.”
Section titled “All of these concepts help us identify how “Bigger is Better.””- Economies of Scale are based on the portions of the lecture in which we talk about production functions and inputs like labor and capital.
- Returns to Scale is based on the portion of the lecture in which we talk about total costs, average costs, and marginal costs (TC, AC, and MC).
- Therefore, they both cover the same idea; they just use different tools. They just describe that idea using tools from different parts of the lecture.
- In contrast, economies of scope doesn’t build on tools from the lecture and just introduces a third way of thinking about how “Bigger is Better.”
Returns to Scale, Economies of Scale, and Economies of Scope all help us identify different ways in which “bigger is better.” They are completely separate concepts that each capture ways in which a larger firm can be more efficient. It is similar to how the six blind men each capture different aspects of an elephant in the parable of the Blind men and the Elephant.
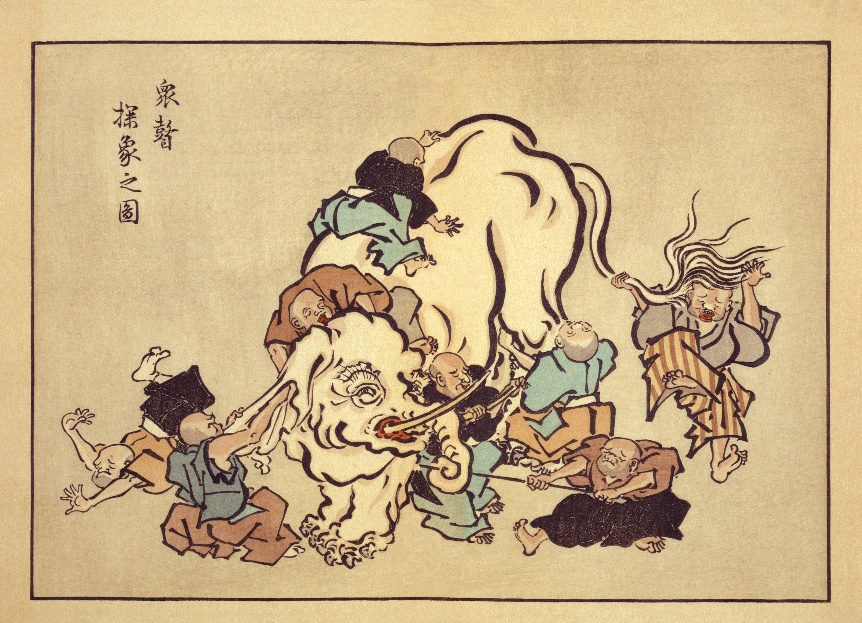
Parable of the “Blind men and an elephant"
"It is like a snake,” said the person touching its trunk.
”It is like a fan,” said the person touching its ear.
”It is like a pillar,” said the person touching its leg.
”It is like a wall,” said the person touching its side.
”It is like a rope,” said the person touching its tail.
”It is like a spear,” said the person touching its tusk.
Image: Blind monks examining an elephant, an ukiyo-e print by Hanabusa Itchō (1652–1724). (Wikipedia)

Returns to Scale, Economies of Scale, and Economies of Scope all help us identify different ways in which “bigger is better.” They are completely separate concepts that each describe ways in which a larger firm can be more efficient. It is similar to how the six blind men each capture different aspects of an elephant.
Specifically:
- Returns to scale looks at the quantity of various inputs vs quantity of output
- Economies of Scale looks at Long Run Average Cost vs quantity of output.
- Economies of Scope talks about different products.
Returns to Scale is about Output Quantity:
Section titled “Returns to Scale is about Output Quantity:”
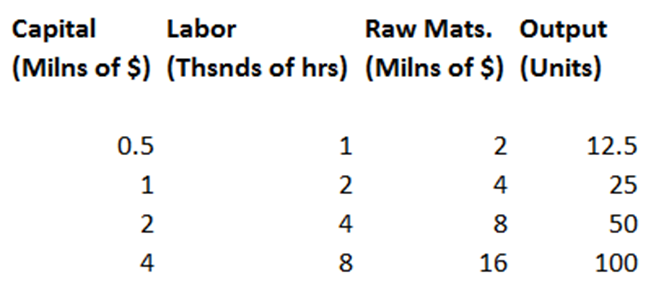
Constant Returns to Scale
Section titled “Constant Returns to Scale”Definition: Increasing all inputs by the same proportion ⇨ increases output by the same proportion
Example: When all inputs are doubled, output doubles:
Increasing Returns to Scale:
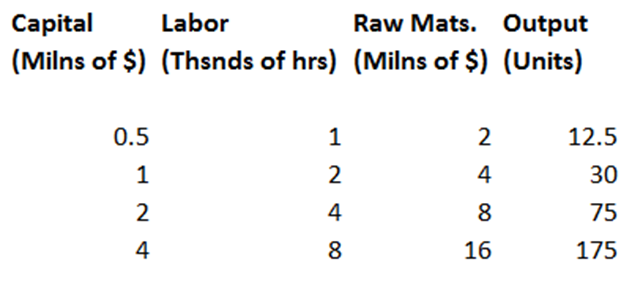
Section titled “Increasing Returns to Scale:”Definition: Increasing all inputs by the same proportion ⇨ increases output by a greater proportion
Example: When all inputs are doubled, output more than doubles:
Decreasing Returns to Scale:
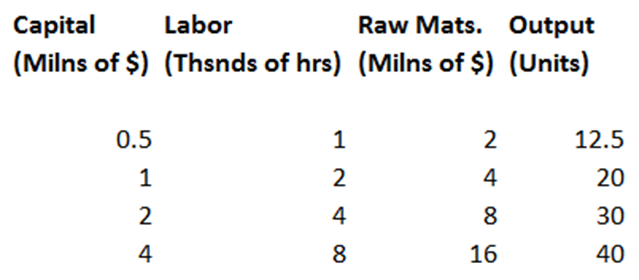
Section titled “Decreasing Returns to Scale:”Definition: Increasing all inputs by the same proportion ⇨ increases output by a smaller proportion
Example: When all inputs are doubled, output increases by less than double
Economies of Scale are about Long Run Average Cost (LAC)
Section titled “Economies of Scale are about Long Run Average Cost (LAC)”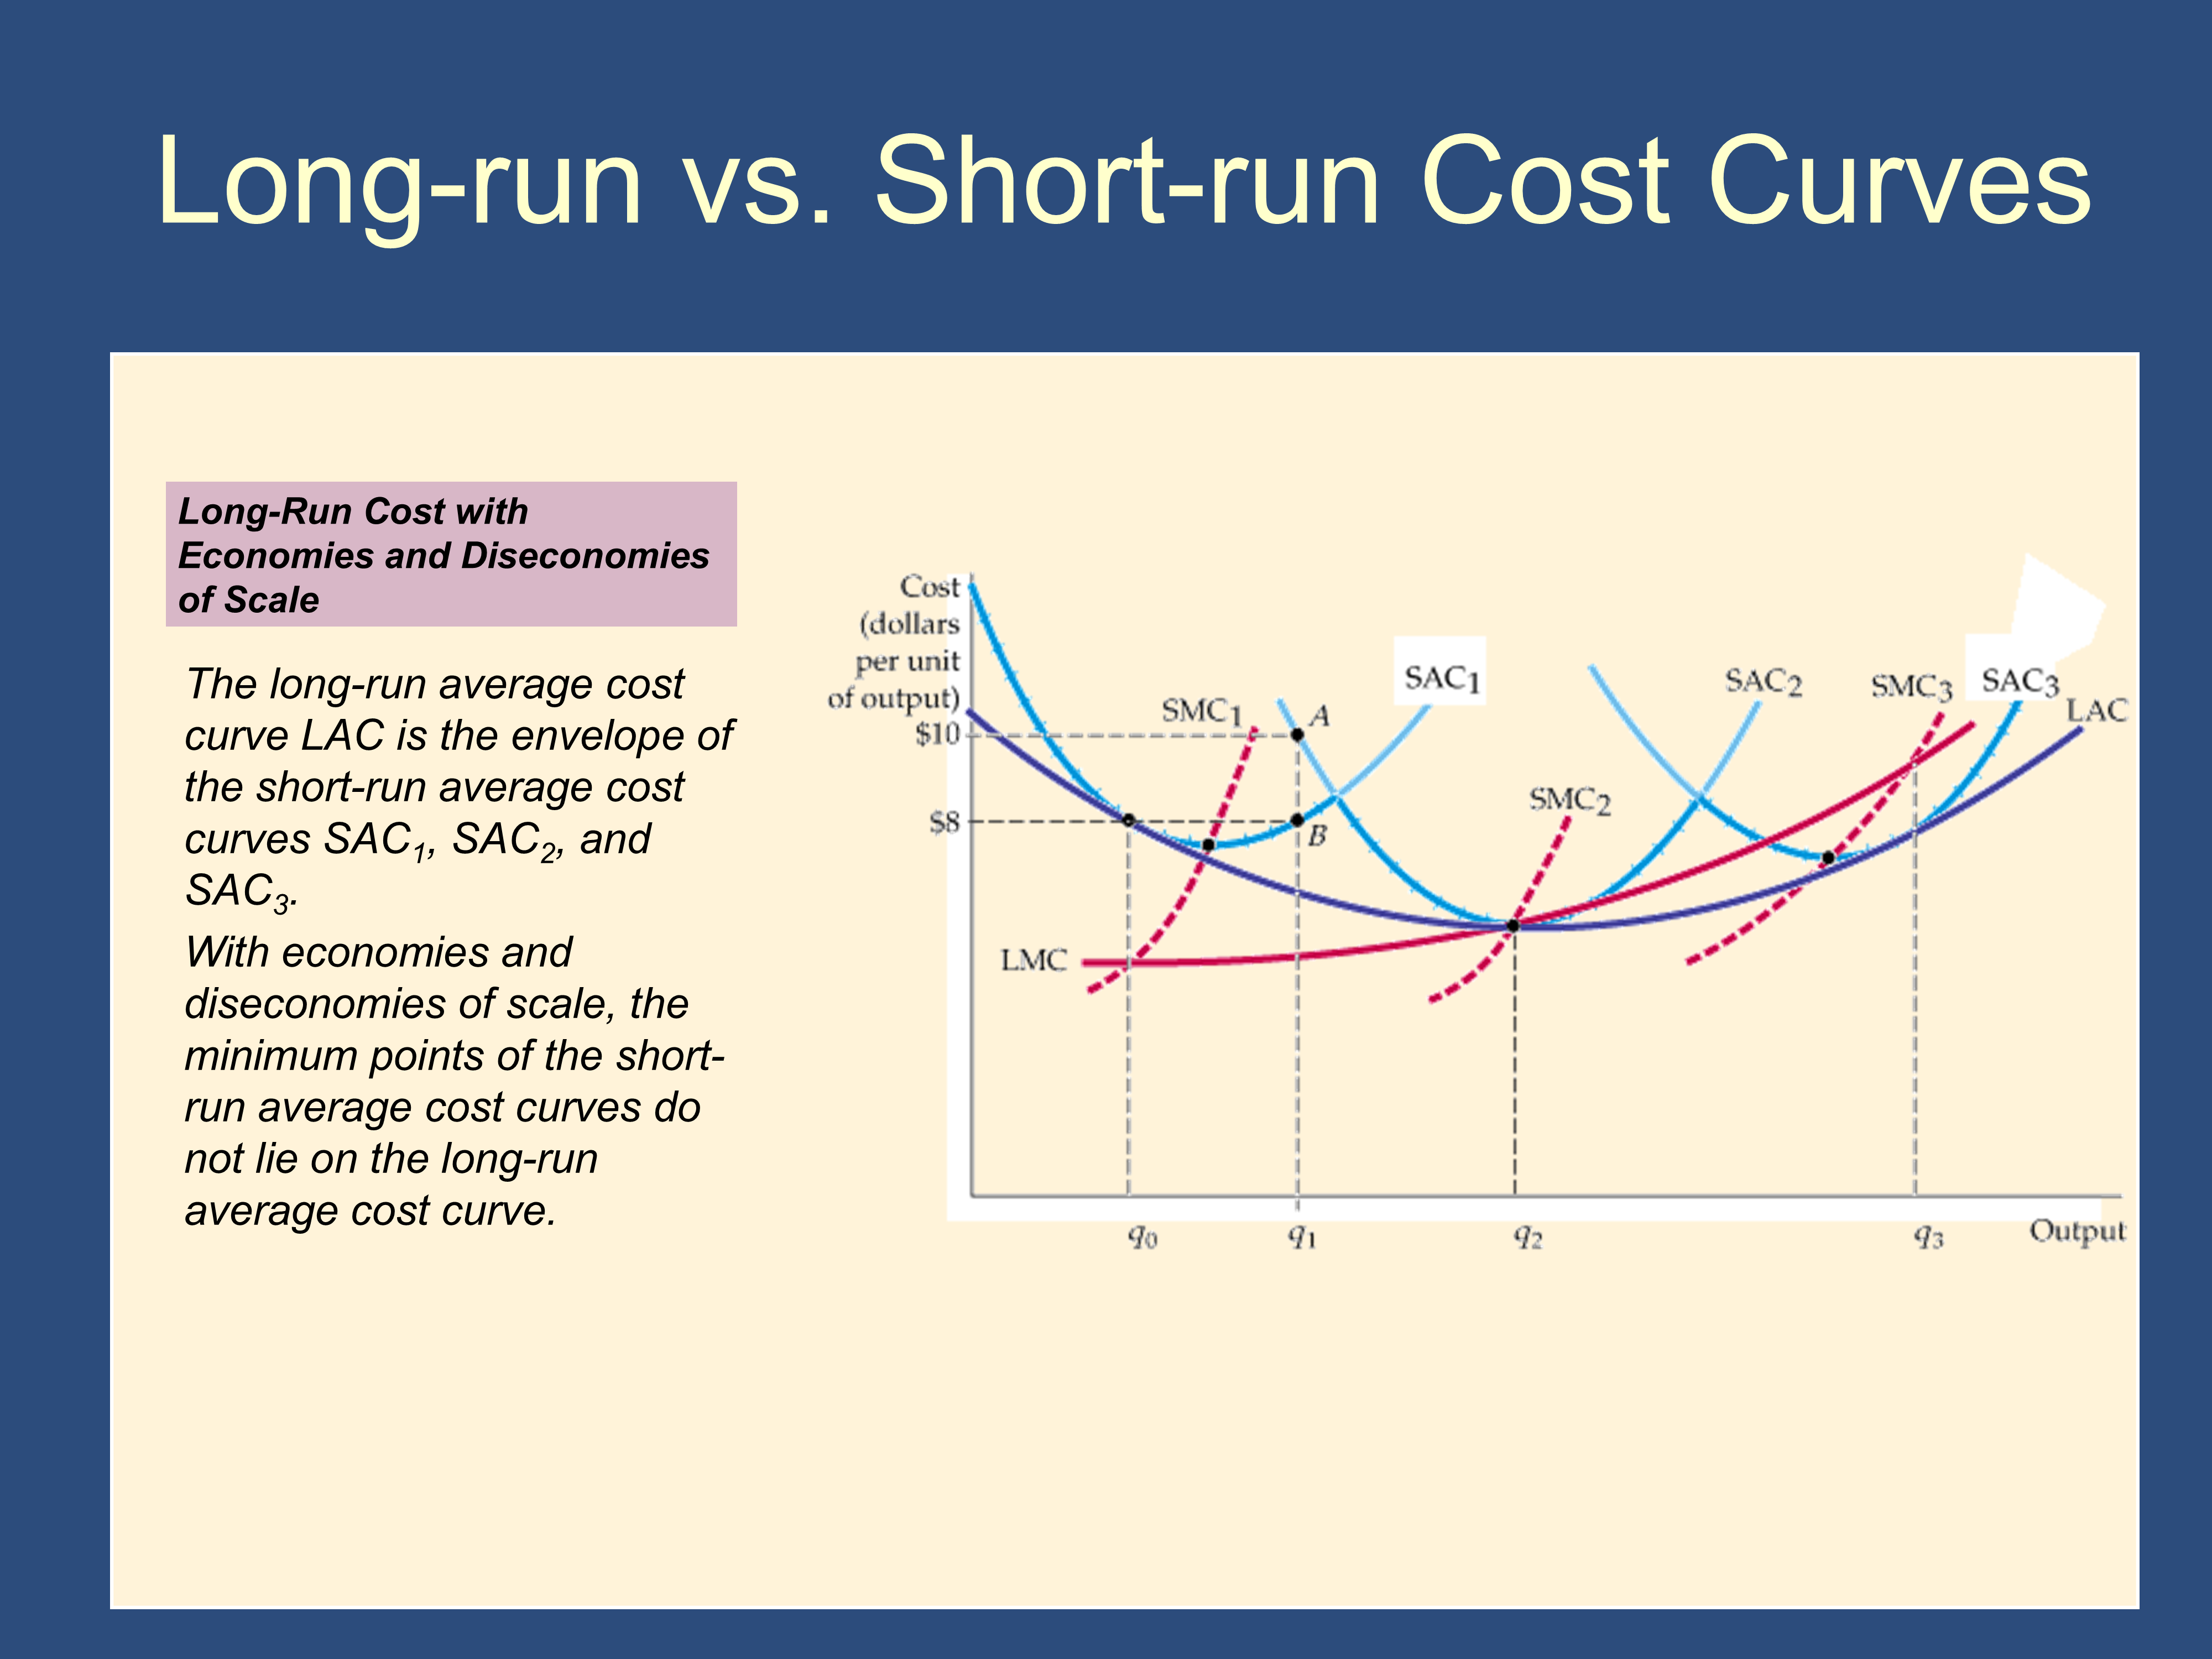
Intuitively, there are connections between the two concepts, but you should see them as separate.
Economies of Scale:
Section titled “Economies of Scale:”Definition: A given percentage increase in output causes a smaller percentage increase in costs
Example: A 50% output increase only increases costs by 30%
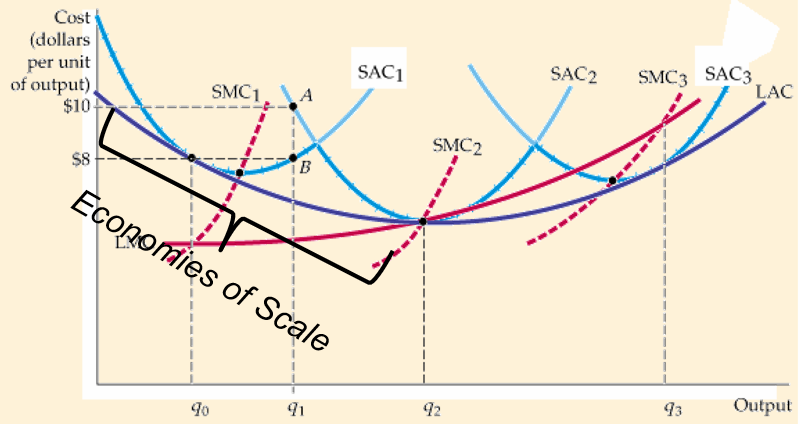
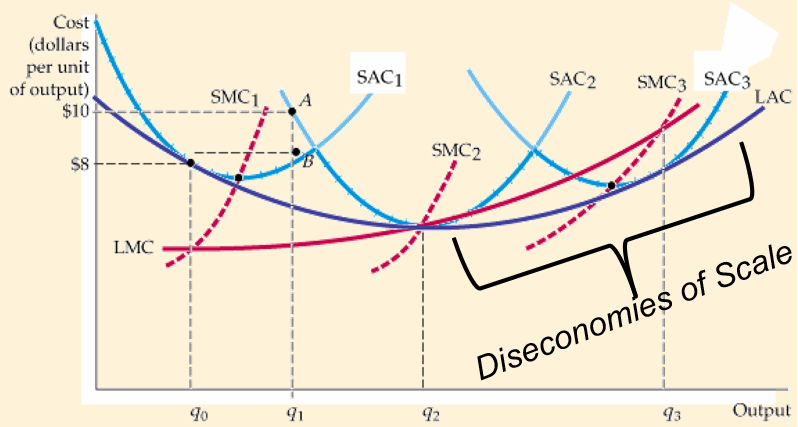
If economies of scale are present, Long-Run Average Costs will be decreasing. In fact—decreasing LRAC is pretty much synonymous with economies of scale:
Diseconomies of Scale:
Section titled “Diseconomies of Scale:”Definition: A given percentage increase in output causes a larger percentage increase in costs
Example: A 50% output increase increases costs by 70%
If diseconomies of scale are present, long-run average costs will be increasing. In fact—increasing LRAC is pretty much synonymous with diseconomies of scale
Economies of Scope
Section titled “Economies of Scope”economies of scope Situation in which joint output of a single firm is greater than output that could be achieved by two different firms when each produces a single product
diseconomies of scope Situation in which joint output of a single firm is less than could be achieved by separate firms when each produces a single product.
degree of economies of scope (SC) Percentage of cost savings resulting when two or more products are produced jointly rather than Individually.
He did the example where Bruichladdich distillery was only in one line of business (Scotch Whisky). However, when it expanded into a second line of business (Gin) it had “synergies.”
Feedback? Email munger.e1010@gmail.com 📧. Be sure to mention the page you are responding to.