👨🏫 Notes on Lecture 1
In the sidebar are a collection of pages that review the content from E-1000. Whether you did or didn’t take E-1000, you may find these helpful.
Models
Section titled “Models”A model is a simplification of reality.
When evaluating a model, don’t ask “Is this realistic?” Instead ask “Is this useful?” (ie is it Useful for understanding. Is it useful for prediction.)
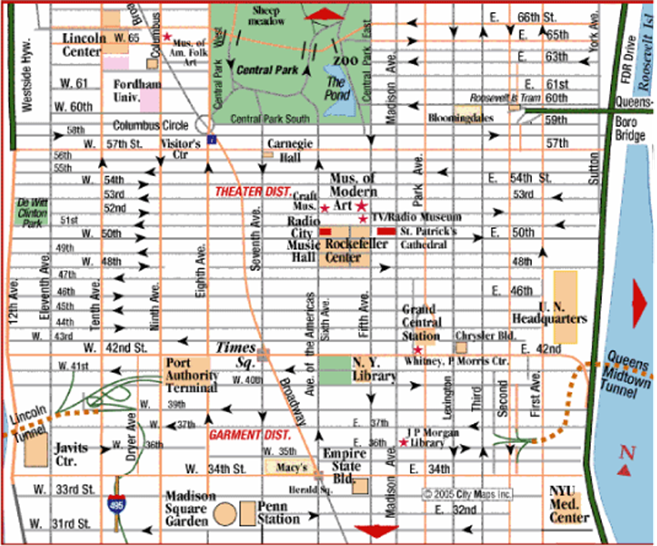
A map is a model: a simplified description of reality that you can use to make predictions.
The glory of economics: unified explanation based on rational optimization.
Demand and Supply
Section titled “Demand and Supply”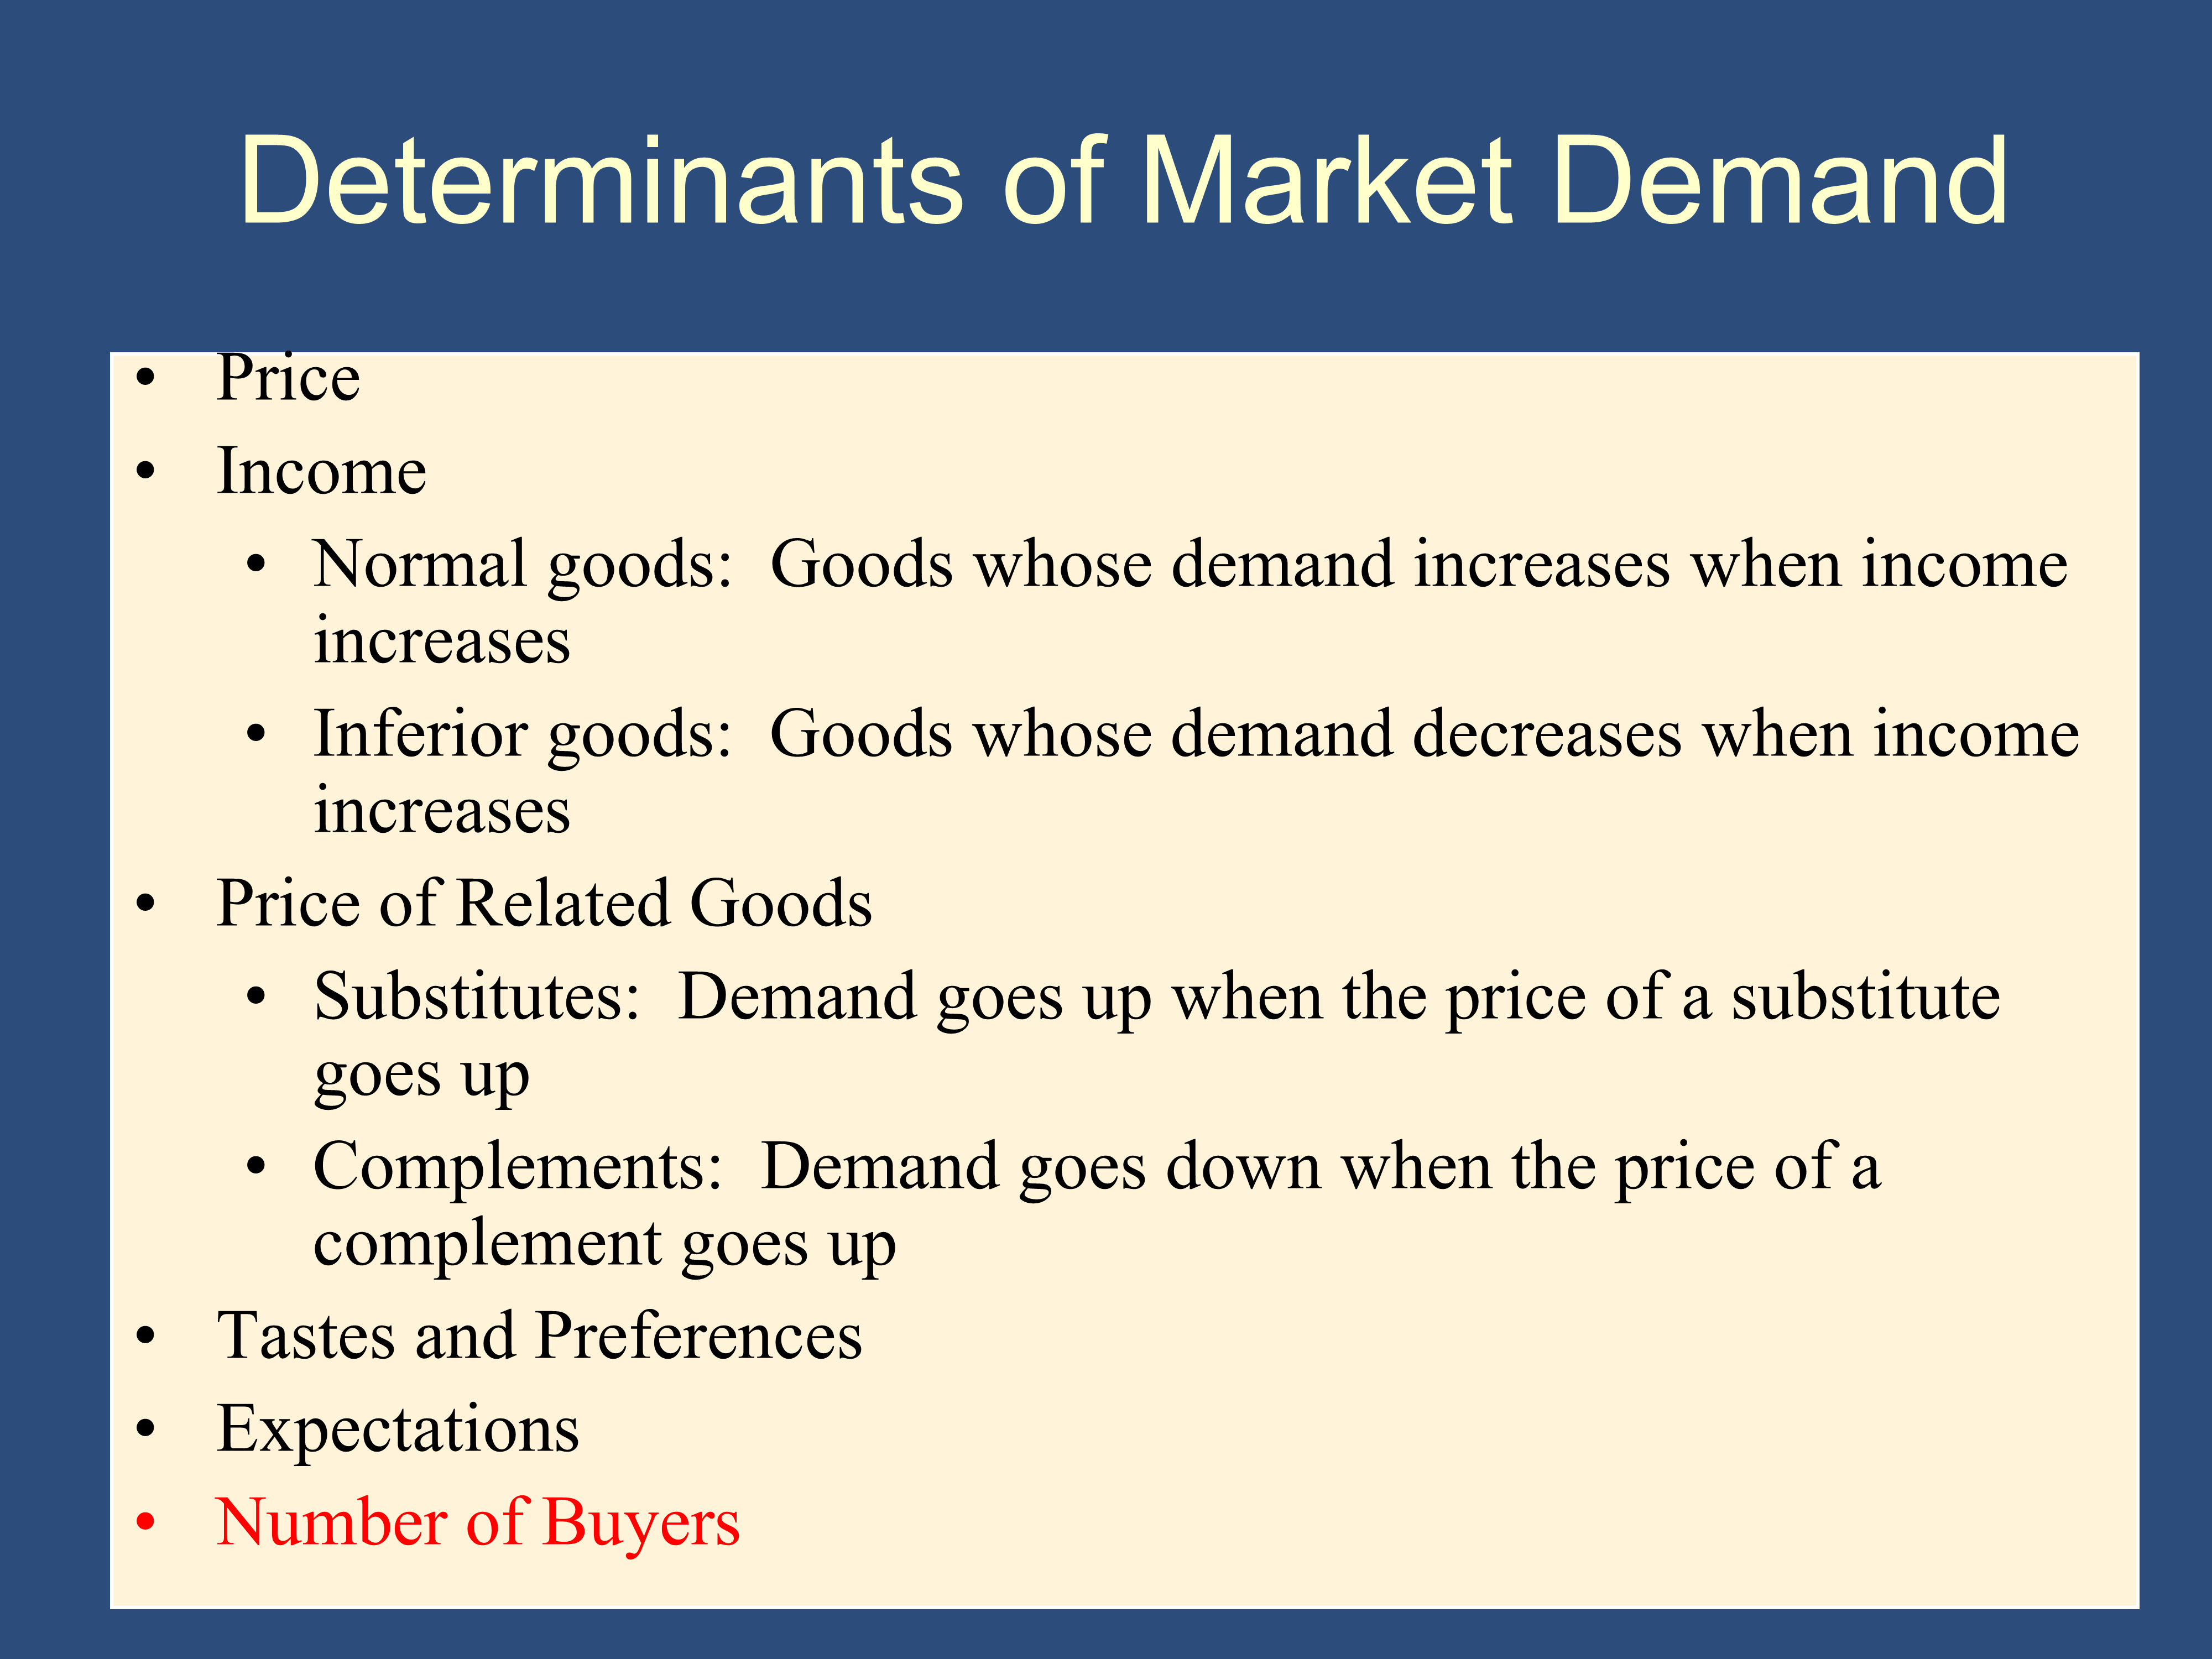
For a hamburger, a hot dog would be a substitute and a hamburger bun would be a complement. If the price of hamburgers goes up, demand for hamburger buns will fall (because people buy less hamburger meat). Likewise, the demand for hot dogs will rise (because people buy hot dogs instead of hamburgers).
The slide shows determinants of Market Demand. The determinants of individual demand are similar except they don’t include Number of Buyers.
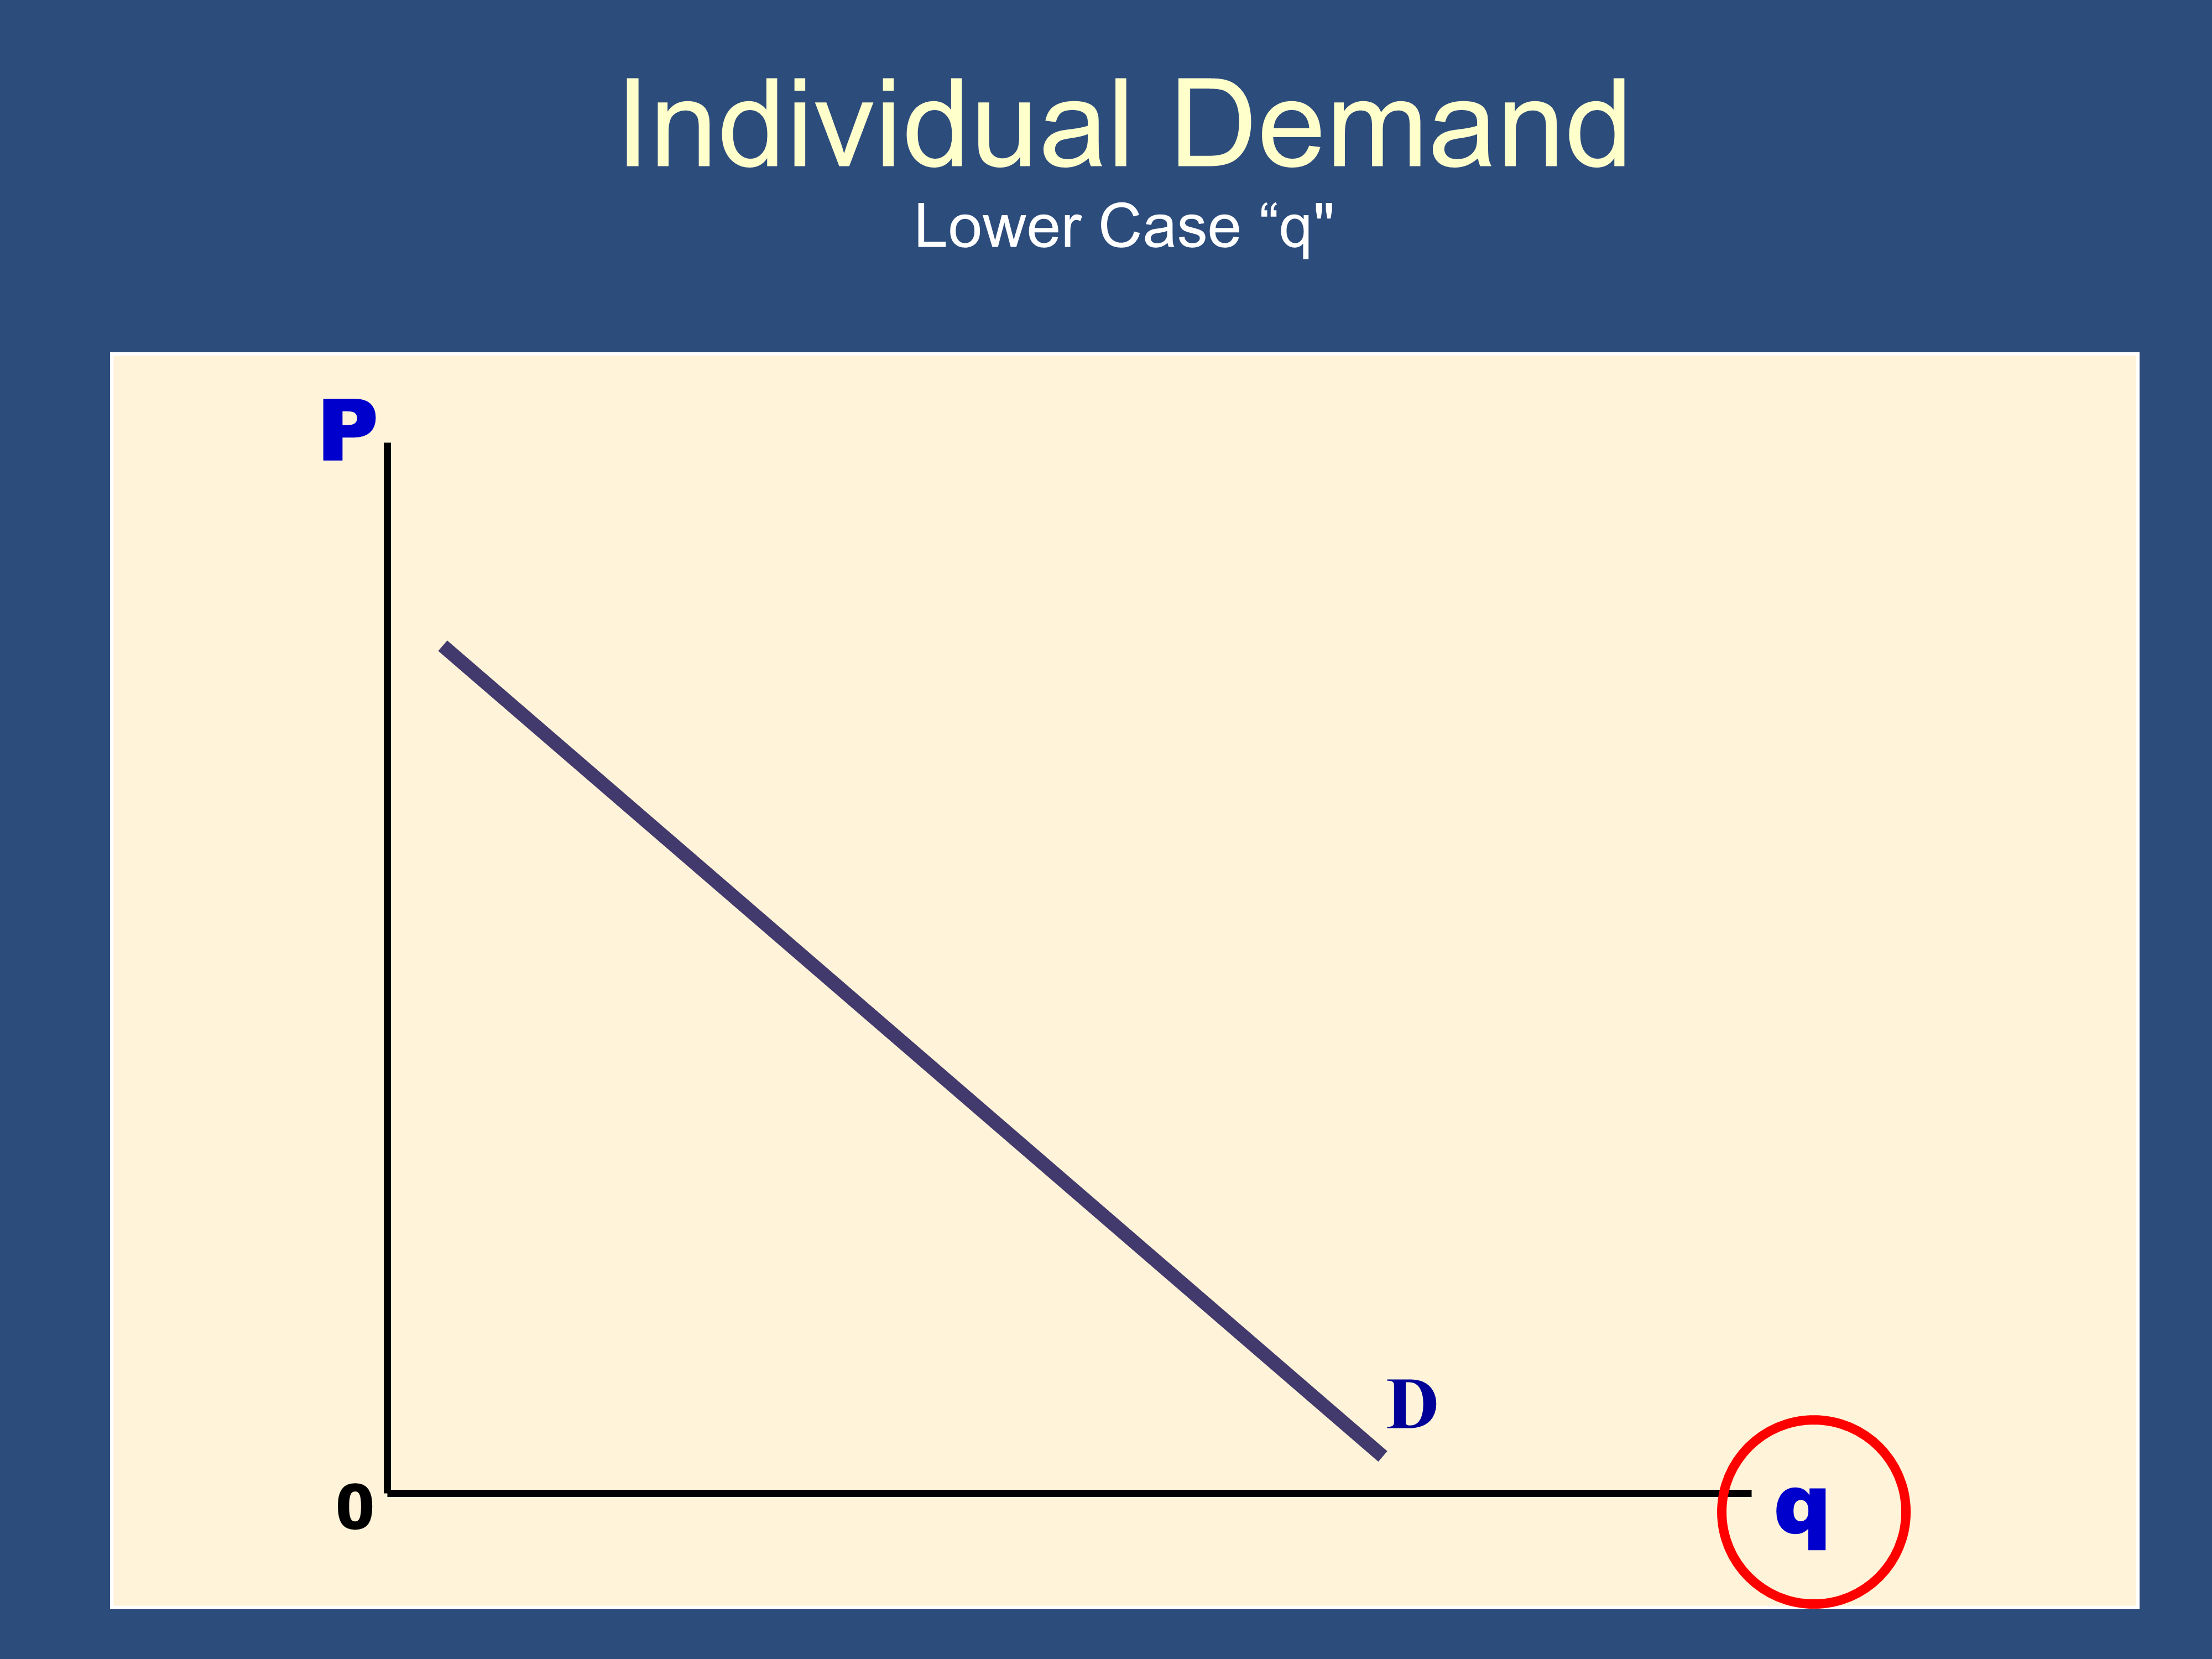
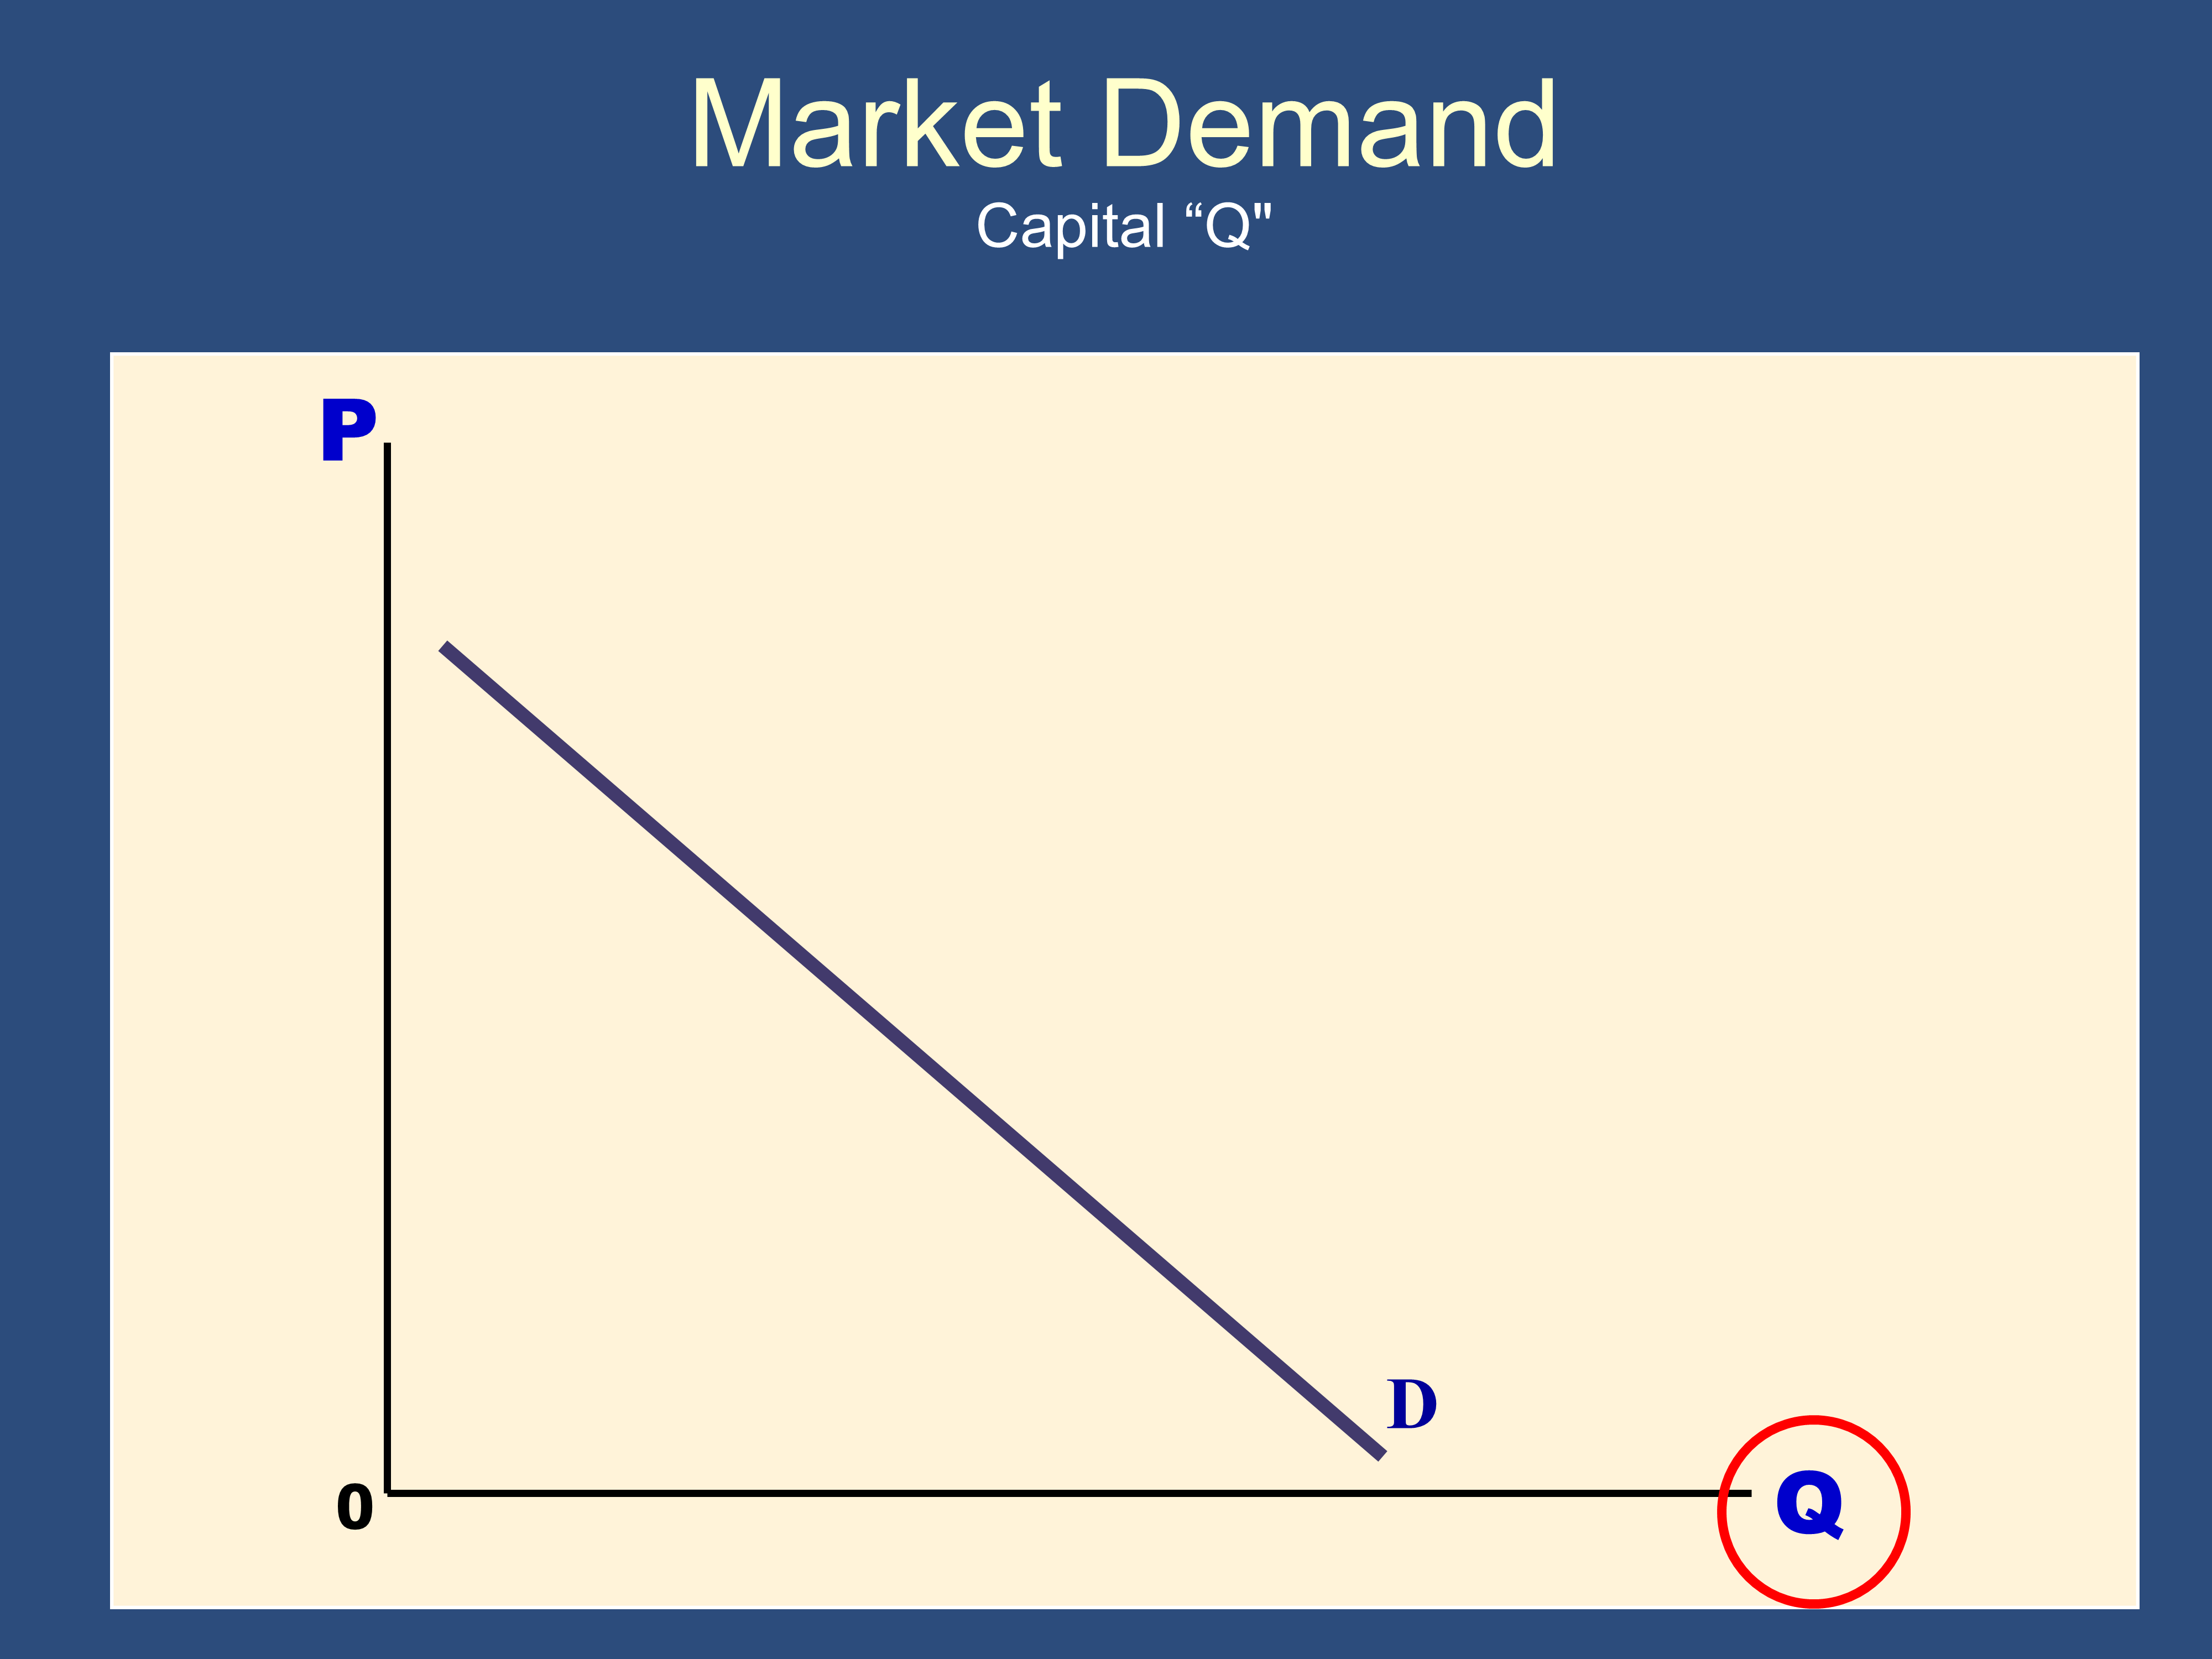
q indicates individual quantity demanded and Q indicates quantity demanded in the entire market.
 |  |
|---|
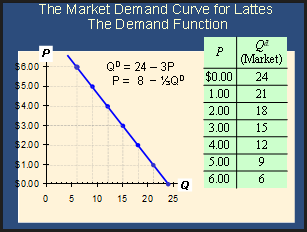
A demand schedule is just the demand curve in tabular format.
Feedback? Email munger.e1010@gmail.com 📧. Be sure to mention the page you are responding to.